Immigrants from West Indies vs Immigrants from Western Africa GED/Equivalency
COMPARE
Immigrants from West Indies
Immigrants from Western Africa
GED/Equivalency
GED/Equivalency Comparison
Immigrants from West Indies
Immigrants from Western Africa
82.4%
GED/EQUIVALENCY
0.0/ 100
METRIC RATING
286th/ 347
METRIC RANK
83.8%
GED/EQUIVALENCY
1.1/ 100
METRIC RATING
247th/ 347
METRIC RANK
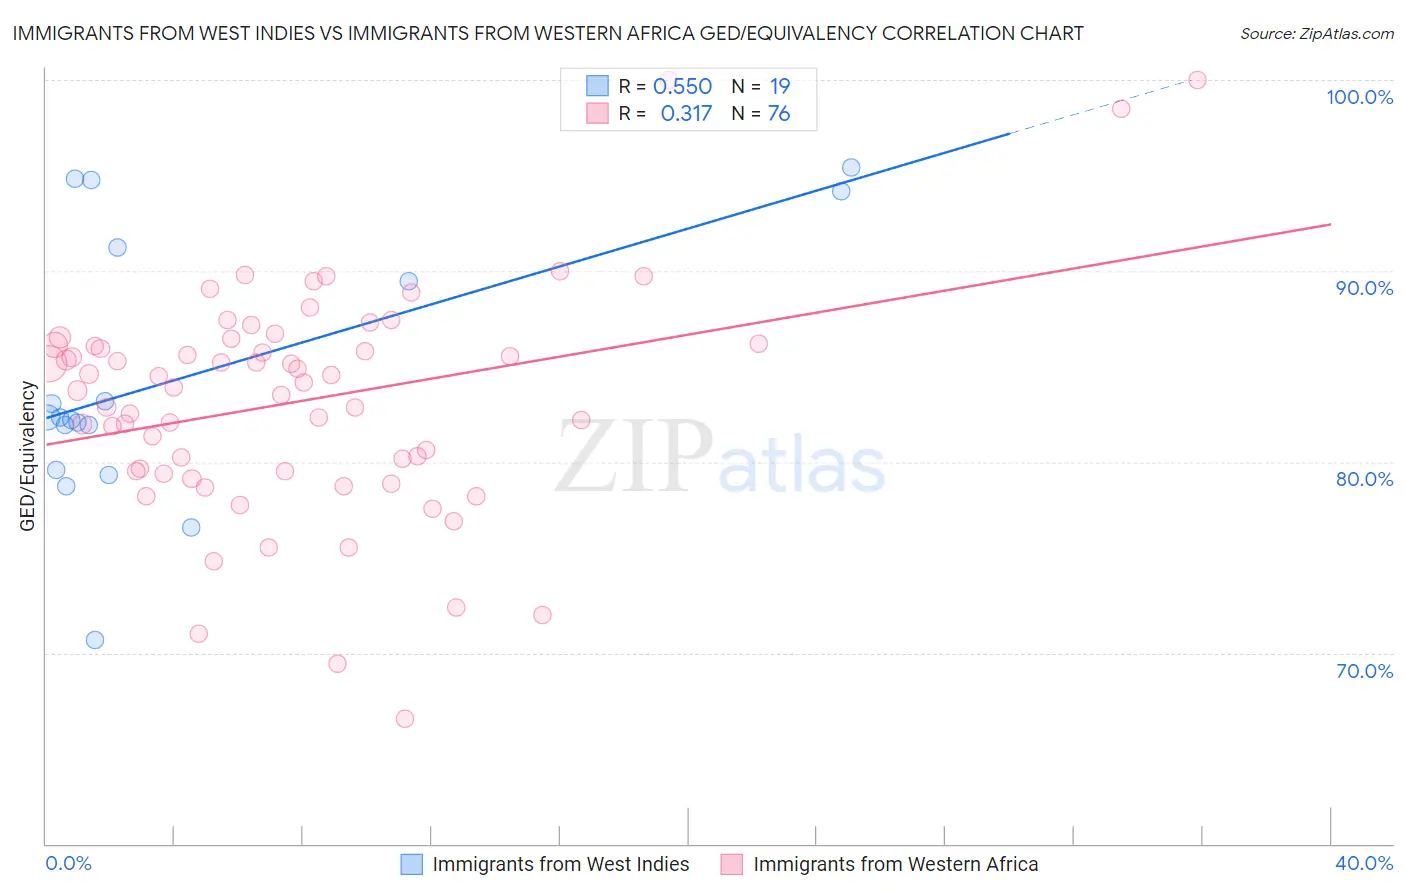
Immigrants from West Indies vs Immigrants from Western Africa GED/Equivalency Correlation Chart
The statistical analysis conducted on geographies consisting of 72,457,514 people shows a substantial positive correlation between the proportion of Immigrants from West Indies and percentage of population with at least ged/equivalency education in the United States with a correlation coefficient (R) of 0.550 and weighted average of 82.4%. Similarly, the statistical analysis conducted on geographies consisting of 357,885,284 people shows a mild positive correlation between the proportion of Immigrants from Western Africa and percentage of population with at least ged/equivalency education in the United States with a correlation coefficient (R) of 0.317 and weighted average of 83.8%, a difference of 1.7%.
GED/Equivalency Correlation Summary
| Measurement | Immigrants from West Indies | Immigrants from Western Africa |
| Minimum | 70.7% | 66.5% |
| Maximum | 95.4% | 100.0% |
| Range | 24.7% | 33.5% |
| Mean | 84.4% | 83.2% |
| Median | 82.3% | 84.0% |
| Interquartile 25% (IQ1) | 79.6% | 79.5% |
| Interquartile 75% (IQ3) | 91.2% | 86.2% |
| Interquartile Range (IQR) | 11.7% | 6.7% |
| Standard Deviation (Sample) | 7.0% | 6.0% |
| Standard Deviation (Population) | 6.8% | 5.9% |
Similar Demographics by GED/Equivalency
Demographics Similar to Immigrants from West Indies by GED/Equivalency
In terms of ged/equivalency, the demographic groups most similar to Immigrants from West Indies are Cajun (82.4%, a difference of 0.020%), Japanese (82.4%, a difference of 0.020%), Immigrants from Barbados (82.4%, a difference of 0.060%), Pueblo (82.3%, a difference of 0.12%), and Indonesian (82.5%, a difference of 0.18%).
| Demographics | Rating | Rank | GED/Equivalency |
| Immigrants | Fiji | 0.1 /100 | #279 | Tragic 82.7% |
| Cheyenne | 0.1 /100 | #280 | Tragic 82.7% |
| Sioux | 0.1 /100 | #281 | Tragic 82.6% |
| Immigrants | Immigrants | 0.1 /100 | #282 | Tragic 82.6% |
| Indonesians | 0.1 /100 | #283 | Tragic 82.5% |
| Immigrants | Barbados | 0.1 /100 | #284 | Tragic 82.4% |
| Cajuns | 0.0 /100 | #285 | Tragic 82.4% |
| Immigrants | West Indies | 0.0 /100 | #286 | Tragic 82.4% |
| Japanese | 0.0 /100 | #287 | Tragic 82.4% |
| Pueblo | 0.0 /100 | #288 | Tragic 82.3% |
| Immigrants | Cambodia | 0.0 /100 | #289 | Tragic 82.2% |
| Haitians | 0.0 /100 | #290 | Tragic 82.1% |
| Cubans | 0.0 /100 | #291 | Tragic 82.0% |
| Paiute | 0.0 /100 | #292 | Tragic 82.0% |
| British West Indians | 0.0 /100 | #293 | Tragic 82.0% |
Demographics Similar to Immigrants from Western Africa by GED/Equivalency
In terms of ged/equivalency, the demographic groups most similar to Immigrants from Western Africa are Blackfeet (83.8%, a difference of 0.020%), Crow (83.8%, a difference of 0.020%), Chickasaw (83.8%, a difference of 0.030%), Shoshone (83.7%, a difference of 0.040%), and Immigrants from Senegal (83.8%, a difference of 0.050%).
| Demographics | Rating | Rank | GED/Equivalency |
| Immigrants | South Eastern Asia | 2.5 /100 | #240 | Tragic 84.1% |
| Senegalese | 1.9 /100 | #241 | Tragic 84.0% |
| Sri Lankans | 1.9 /100 | #242 | Tragic 84.0% |
| Cherokee | 1.3 /100 | #243 | Tragic 83.9% |
| Immigrants | Ghana | 1.3 /100 | #244 | Tragic 83.9% |
| Immigrants | Senegal | 1.2 /100 | #245 | Tragic 83.8% |
| Chickasaw | 1.2 /100 | #246 | Tragic 83.8% |
| Immigrants | Western Africa | 1.1 /100 | #247 | Tragic 83.8% |
| Blackfeet | 1.1 /100 | #248 | Tragic 83.8% |
| Crow | 1.1 /100 | #249 | Tragic 83.8% |
| Shoshone | 1.0 /100 | #250 | Tragic 83.7% |
| Spanish Americans | 0.8 /100 | #251 | Tragic 83.6% |
| Bahamians | 0.8 /100 | #252 | Tragic 83.6% |
| Comanche | 0.7 /100 | #253 | Tragic 83.6% |
| Creek | 0.7 /100 | #254 | Tragic 83.6% |