Immigrants from Thailand vs Arapaho Child Poverty Among Boys Under 16
COMPARE
Immigrants from Thailand
Arapaho
Child Poverty Among Boys Under 16
Child Poverty Among Boys Under 16 Comparison
Immigrants from Thailand
Arapaho
17.5%
CHILD POVERTY AMONG BOYS UNDER 16
8.2/ 100
METRIC RATING
207th/ 347
METRIC RANK
20.2%
CHILD POVERTY AMONG BOYS UNDER 16
0.0/ 100
METRIC RATING
285th/ 347
METRIC RANK
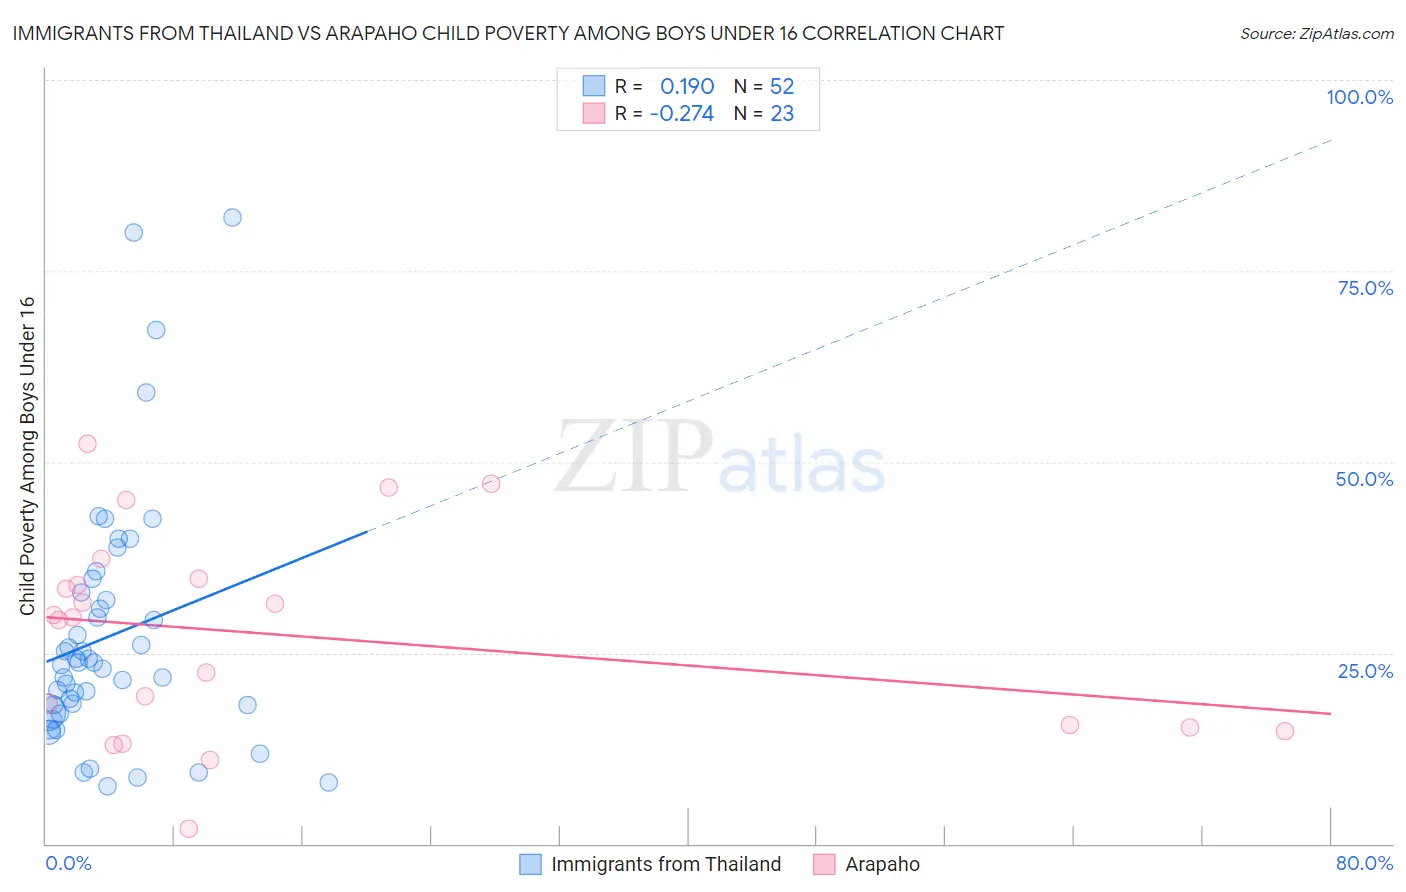
Immigrants from Thailand vs Arapaho Child Poverty Among Boys Under 16 Correlation Chart
The statistical analysis conducted on geographies consisting of 313,818,452 people shows a poor positive correlation between the proportion of Immigrants from Thailand and poverty level among boys under the age of 16 in the United States with a correlation coefficient (R) of 0.190 and weighted average of 17.5%. Similarly, the statistical analysis conducted on geographies consisting of 29,694,032 people shows a weak negative correlation between the proportion of Arapaho and poverty level among boys under the age of 16 in the United States with a correlation coefficient (R) of -0.274 and weighted average of 20.2%, a difference of 15.0%.
Child Poverty Among Boys Under 16 Correlation Summary
| Measurement | Immigrants from Thailand | Arapaho |
| Minimum | 7.6% | 1.9% |
| Maximum | 82.1% | 52.3% |
| Range | 74.5% | 50.4% |
| Mean | 27.1% | 27.3% |
| Median | 23.5% | 29.6% |
| Interquartile 25% (IQ1) | 17.7% | 15.3% |
| Interquartile 75% (IQ3) | 32.4% | 34.8% |
| Interquartile Range (IQR) | 14.7% | 19.5% |
| Standard Deviation (Sample) | 16.3% | 13.4% |
| Standard Deviation (Population) | 16.1% | 13.1% |
Similar Demographics by Child Poverty Among Boys Under 16
Demographics Similar to Immigrants from Thailand by Child Poverty Among Boys Under 16
In terms of child poverty among boys under 16, the demographic groups most similar to Immigrants from Thailand are Malaysian (17.6%, a difference of 0.22%), Alaskan Athabascan (17.6%, a difference of 0.32%), Immigrants from Armenia (17.6%, a difference of 0.50%), Immigrants (17.6%, a difference of 0.56%), and Aleut (17.7%, a difference of 0.61%).
| Demographics | Rating | Rank | Child Poverty Among Boys Under 16 |
| Immigrants | Uruguay | 16.9 /100 | #200 | Poor 17.2% |
| Immigrants | Afghanistan | 13.7 /100 | #201 | Poor 17.3% |
| Immigrants | Sierra Leone | 13.4 /100 | #202 | Poor 17.3% |
| Immigrants | Uzbekistan | 13.3 /100 | #203 | Poor 17.3% |
| Ugandans | 12.5 /100 | #204 | Poor 17.3% |
| Immigrants | Portugal | 11.2 /100 | #205 | Poor 17.4% |
| German Russians | 10.9 /100 | #206 | Poor 17.4% |
| Immigrants | Thailand | 8.2 /100 | #207 | Tragic 17.5% |
| Malaysians | 7.6 /100 | #208 | Tragic 17.6% |
| Alaskan Athabascans | 7.3 /100 | #209 | Tragic 17.6% |
| Immigrants | Armenia | 6.8 /100 | #210 | Tragic 17.6% |
| Immigrants | Immigrants | 6.7 /100 | #211 | Tragic 17.6% |
| Aleuts | 6.6 /100 | #212 | Tragic 17.7% |
| Immigrants | Eastern Africa | 6.0 /100 | #213 | Tragic 17.7% |
| Panamanians | 5.9 /100 | #214 | Tragic 17.7% |
Demographics Similar to Arapaho by Child Poverty Among Boys Under 16
In terms of child poverty among boys under 16, the demographic groups most similar to Arapaho are Barbadian (20.2%, a difference of 0.15%), West Indian (20.3%, a difference of 0.34%), Immigrants from Jamaica (20.1%, a difference of 0.38%), Immigrants from Belize (20.3%, a difference of 0.40%), and Comanche (20.1%, a difference of 0.50%).
| Demographics | Rating | Rank | Child Poverty Among Boys Under 16 |
| Immigrants | West Indies | 0.0 /100 | #278 | Tragic 20.0% |
| Bangladeshis | 0.0 /100 | #279 | Tragic 20.0% |
| Central Americans | 0.0 /100 | #280 | Tragic 20.1% |
| Immigrants | Zaire | 0.0 /100 | #281 | Tragic 20.1% |
| Comanche | 0.0 /100 | #282 | Tragic 20.1% |
| Immigrants | Jamaica | 0.0 /100 | #283 | Tragic 20.1% |
| Barbadians | 0.0 /100 | #284 | Tragic 20.2% |
| Arapaho | 0.0 /100 | #285 | Tragic 20.2% |
| West Indians | 0.0 /100 | #286 | Tragic 20.3% |
| Immigrants | Belize | 0.0 /100 | #287 | Tragic 20.3% |
| Immigrants | St. Vincent and the Grenadines | 0.0 /100 | #288 | Tragic 20.3% |
| Blackfeet | 0.0 /100 | #289 | Tragic 20.4% |
| Senegalese | 0.0 /100 | #290 | Tragic 20.6% |
| Immigrants | Latin America | 0.0 /100 | #291 | Tragic 20.6% |
| Yaqui | 0.0 /100 | #292 | Tragic 20.7% |