Fijian vs Immigrants from Bangladesh College, Under 1 year
COMPARE
Fijian
Immigrants from Bangladesh
College, Under 1 year
College, Under 1 year Comparison
Fijians
Immigrants from Bangladesh
57.7%
COLLEGE, UNDER 1 YEAR
0.0/ 100
METRIC RATING
307th/ 347
METRIC RANK
61.3%
COLLEGE, UNDER 1 YEAR
0.3/ 100
METRIC RATING
258th/ 347
METRIC RANK
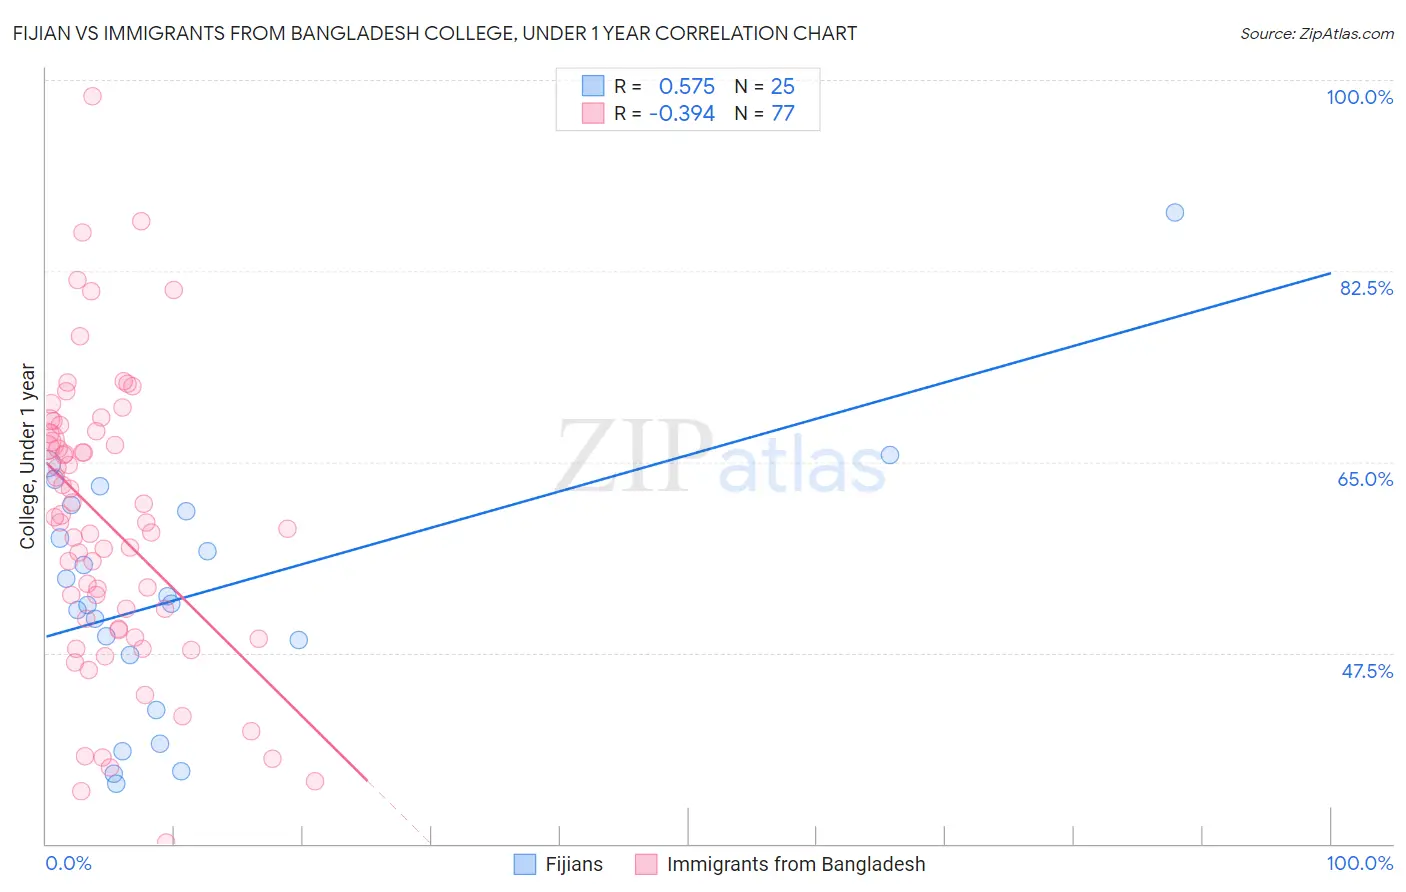
Fijian vs Immigrants from Bangladesh College, Under 1 year Correlation Chart
The statistical analysis conducted on geographies consisting of 55,948,842 people shows a substantial positive correlation between the proportion of Fijians and percentage of population with at least college, under 1 year education in the United States with a correlation coefficient (R) of 0.575 and weighted average of 57.7%. Similarly, the statistical analysis conducted on geographies consisting of 203,680,658 people shows a mild negative correlation between the proportion of Immigrants from Bangladesh and percentage of population with at least college, under 1 year education in the United States with a correlation coefficient (R) of -0.394 and weighted average of 61.3%, a difference of 6.2%.
College, Under 1 year Correlation Summary
| Measurement | Fijian | Immigrants from Bangladesh |
| Minimum | 35.5% | 30.1% |
| Maximum | 87.8% | 98.6% |
| Range | 52.4% | 68.5% |
| Mean | 52.9% | 59.4% |
| Median | 52.0% | 59.4% |
| Interquartile 25% (IQ1) | 44.7% | 49.6% |
| Interquartile 75% (IQ3) | 60.7% | 67.7% |
| Interquartile Range (IQR) | 16.0% | 18.1% |
| Standard Deviation (Sample) | 11.8% | 13.2% |
| Standard Deviation (Population) | 11.5% | 13.1% |
Similar Demographics by College, Under 1 year
Demographics Similar to Fijians by College, Under 1 year
In terms of college, under 1 year, the demographic groups most similar to Fijians are Central American (57.7%, a difference of 0.0%), Immigrants from Portugal (57.7%, a difference of 0.010%), Immigrants from Nicaragua (57.6%, a difference of 0.12%), Haitian (57.8%, a difference of 0.21%), and Kiowa (57.8%, a difference of 0.32%).
| Demographics | Rating | Rank | College, Under 1 year |
| Immigrants | Guyana | 0.0 /100 | #300 | Tragic 58.5% |
| Mexican American Indians | 0.0 /100 | #301 | Tragic 58.1% |
| Apache | 0.0 /100 | #302 | Tragic 58.0% |
| Immigrants | Dominica | 0.0 /100 | #303 | Tragic 57.9% |
| Kiowa | 0.0 /100 | #304 | Tragic 57.8% |
| Haitians | 0.0 /100 | #305 | Tragic 57.8% |
| Immigrants | Portugal | 0.0 /100 | #306 | Tragic 57.7% |
| Fijians | 0.0 /100 | #307 | Tragic 57.7% |
| Central Americans | 0.0 /100 | #308 | Tragic 57.7% |
| Immigrants | Nicaragua | 0.0 /100 | #309 | Tragic 57.6% |
| Pueblo | 0.0 /100 | #310 | Tragic 57.4% |
| Cajuns | 0.0 /100 | #311 | Tragic 57.3% |
| Salvadorans | 0.0 /100 | #312 | Tragic 57.3% |
| Dutch West Indians | 0.0 /100 | #313 | Tragic 57.2% |
| Hopi | 0.0 /100 | #314 | Tragic 57.1% |
Demographics Similar to Immigrants from Bangladesh by College, Under 1 year
In terms of college, under 1 year, the demographic groups most similar to Immigrants from Bangladesh are Indonesian (61.2%, a difference of 0.020%), Immigrants from Laos (61.3%, a difference of 0.060%), Bangladeshi (61.4%, a difference of 0.17%), Blackfeet (61.1%, a difference of 0.19%), and Comanche (61.4%, a difference of 0.22%).
| Demographics | Rating | Rank | College, Under 1 year |
| Immigrants | Micronesia | 0.5 /100 | #251 | Tragic 61.5% |
| West Indians | 0.4 /100 | #252 | Tragic 61.5% |
| Japanese | 0.4 /100 | #253 | Tragic 61.5% |
| Immigrants | Cambodia | 0.4 /100 | #254 | Tragic 61.5% |
| Comanche | 0.4 /100 | #255 | Tragic 61.4% |
| Bangladeshis | 0.4 /100 | #256 | Tragic 61.4% |
| Immigrants | Laos | 0.3 /100 | #257 | Tragic 61.3% |
| Immigrants | Bangladesh | 0.3 /100 | #258 | Tragic 61.3% |
| Indonesians | 0.3 /100 | #259 | Tragic 61.2% |
| Blackfeet | 0.3 /100 | #260 | Tragic 61.1% |
| Africans | 0.3 /100 | #261 | Tragic 61.1% |
| Barbadians | 0.2 /100 | #262 | Tragic 61.1% |
| Shoshone | 0.2 /100 | #263 | Tragic 61.1% |
| Trinidadians and Tobagonians | 0.2 /100 | #264 | Tragic 61.1% |
| Immigrants | Bahamas | 0.2 /100 | #265 | Tragic 61.1% |