Immigrants from Northern Europe vs Immigrants from Bangladesh College, Under 1 year
COMPARE
Immigrants from Northern Europe
Immigrants from Bangladesh
College, Under 1 year
College, Under 1 year Comparison
Immigrants from Northern Europe
Immigrants from Bangladesh
71.1%
COLLEGE, UNDER 1 YEAR
100.0/ 100
METRIC RATING
23rd/ 347
METRIC RANK
61.3%
COLLEGE, UNDER 1 YEAR
0.3/ 100
METRIC RATING
258th/ 347
METRIC RANK
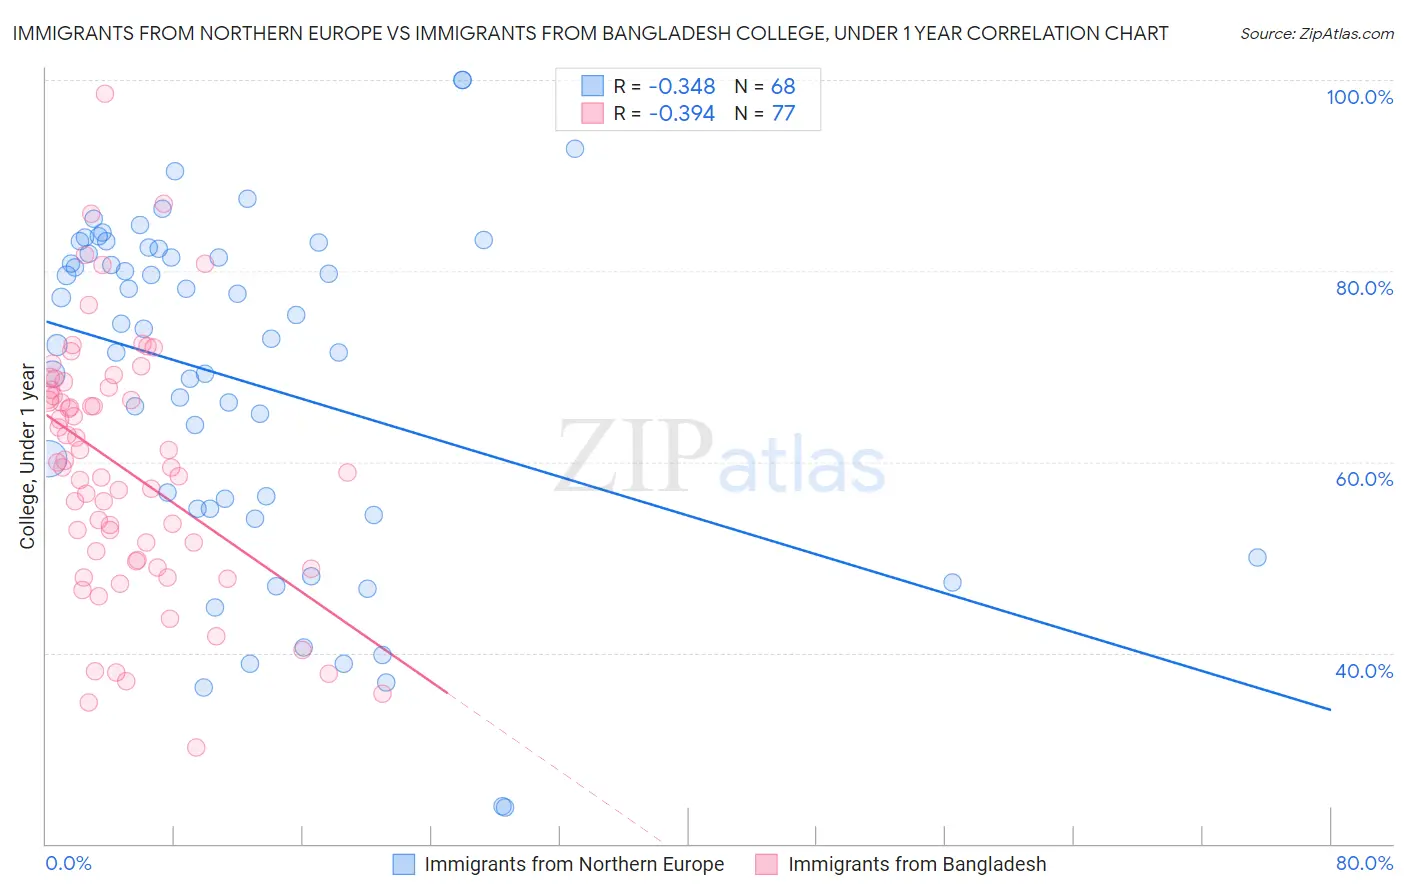
Immigrants from Northern Europe vs Immigrants from Bangladesh College, Under 1 year Correlation Chart
The statistical analysis conducted on geographies consisting of 477,223,087 people shows a mild negative correlation between the proportion of Immigrants from Northern Europe and percentage of population with at least college, under 1 year education in the United States with a correlation coefficient (R) of -0.348 and weighted average of 71.1%. Similarly, the statistical analysis conducted on geographies consisting of 203,680,658 people shows a mild negative correlation between the proportion of Immigrants from Bangladesh and percentage of population with at least college, under 1 year education in the United States with a correlation coefficient (R) of -0.394 and weighted average of 61.3%, a difference of 16.1%.
College, Under 1 year Correlation Summary
| Measurement | Immigrants from Northern Europe | Immigrants from Bangladesh |
| Minimum | 23.8% | 30.1% |
| Maximum | 100.0% | 98.6% |
| Range | 76.2% | 68.5% |
| Mean | 68.4% | 59.4% |
| Median | 73.4% | 59.4% |
| Interquartile 25% (IQ1) | 55.1% | 49.6% |
| Interquartile 75% (IQ3) | 82.0% | 67.7% |
| Interquartile Range (IQR) | 26.9% | 18.1% |
| Standard Deviation (Sample) | 18.0% | 13.2% |
| Standard Deviation (Population) | 17.8% | 13.1% |
Similar Demographics by College, Under 1 year
Demographics Similar to Immigrants from Northern Europe by College, Under 1 year
In terms of college, under 1 year, the demographic groups most similar to Immigrants from Northern Europe are Soviet Union (71.1%, a difference of 0.010%), Bulgarian (71.1%, a difference of 0.030%), Immigrants from Denmark (71.0%, a difference of 0.14%), Immigrants from Ireland (71.0%, a difference of 0.15%), and Immigrants from Hong Kong (71.0%, a difference of 0.18%).
| Demographics | Rating | Rank | College, Under 1 year |
| Immigrants | Japan | 100.0 /100 | #16 | Exceptional 71.9% |
| Eastern Europeans | 100.0 /100 | #17 | Exceptional 71.8% |
| Immigrants | Switzerland | 100.0 /100 | #18 | Exceptional 71.7% |
| Latvians | 100.0 /100 | #19 | Exceptional 71.6% |
| Immigrants | Korea | 100.0 /100 | #20 | Exceptional 71.6% |
| Immigrants | Belgium | 100.0 /100 | #21 | Exceptional 71.5% |
| Immigrants | Eastern Asia | 100.0 /100 | #22 | Exceptional 71.3% |
| Immigrants | Northern Europe | 100.0 /100 | #23 | Exceptional 71.1% |
| Soviet Union | 100.0 /100 | #24 | Exceptional 71.1% |
| Bulgarians | 100.0 /100 | #25 | Exceptional 71.1% |
| Immigrants | Denmark | 100.0 /100 | #26 | Exceptional 71.0% |
| Immigrants | Ireland | 100.0 /100 | #27 | Exceptional 71.0% |
| Immigrants | Hong Kong | 100.0 /100 | #28 | Exceptional 71.0% |
| Immigrants | France | 100.0 /100 | #29 | Exceptional 71.0% |
| Immigrants | China | 99.9 /100 | #30 | Exceptional 70.9% |
Demographics Similar to Immigrants from Bangladesh by College, Under 1 year
In terms of college, under 1 year, the demographic groups most similar to Immigrants from Bangladesh are Indonesian (61.2%, a difference of 0.020%), Immigrants from Laos (61.3%, a difference of 0.060%), Bangladeshi (61.4%, a difference of 0.17%), Blackfeet (61.1%, a difference of 0.19%), and Comanche (61.4%, a difference of 0.22%).
| Demographics | Rating | Rank | College, Under 1 year |
| Immigrants | Micronesia | 0.5 /100 | #251 | Tragic 61.5% |
| West Indians | 0.4 /100 | #252 | Tragic 61.5% |
| Japanese | 0.4 /100 | #253 | Tragic 61.5% |
| Immigrants | Cambodia | 0.4 /100 | #254 | Tragic 61.5% |
| Comanche | 0.4 /100 | #255 | Tragic 61.4% |
| Bangladeshis | 0.4 /100 | #256 | Tragic 61.4% |
| Immigrants | Laos | 0.3 /100 | #257 | Tragic 61.3% |
| Immigrants | Bangladesh | 0.3 /100 | #258 | Tragic 61.3% |
| Indonesians | 0.3 /100 | #259 | Tragic 61.2% |
| Blackfeet | 0.3 /100 | #260 | Tragic 61.1% |
| Africans | 0.3 /100 | #261 | Tragic 61.1% |
| Barbadians | 0.2 /100 | #262 | Tragic 61.1% |
| Shoshone | 0.2 /100 | #263 | Tragic 61.1% |
| Trinidadians and Tobagonians | 0.2 /100 | #264 | Tragic 61.1% |
| Immigrants | Bahamas | 0.2 /100 | #265 | Tragic 61.1% |