Indonesian vs Immigrants from Bangladesh College, Under 1 year
COMPARE
Indonesian
Immigrants from Bangladesh
College, Under 1 year
College, Under 1 year Comparison
Indonesians
Immigrants from Bangladesh
61.2%
COLLEGE, UNDER 1 YEAR
0.3/ 100
METRIC RATING
259th/ 347
METRIC RANK
61.3%
COLLEGE, UNDER 1 YEAR
0.3/ 100
METRIC RATING
258th/ 347
METRIC RANK
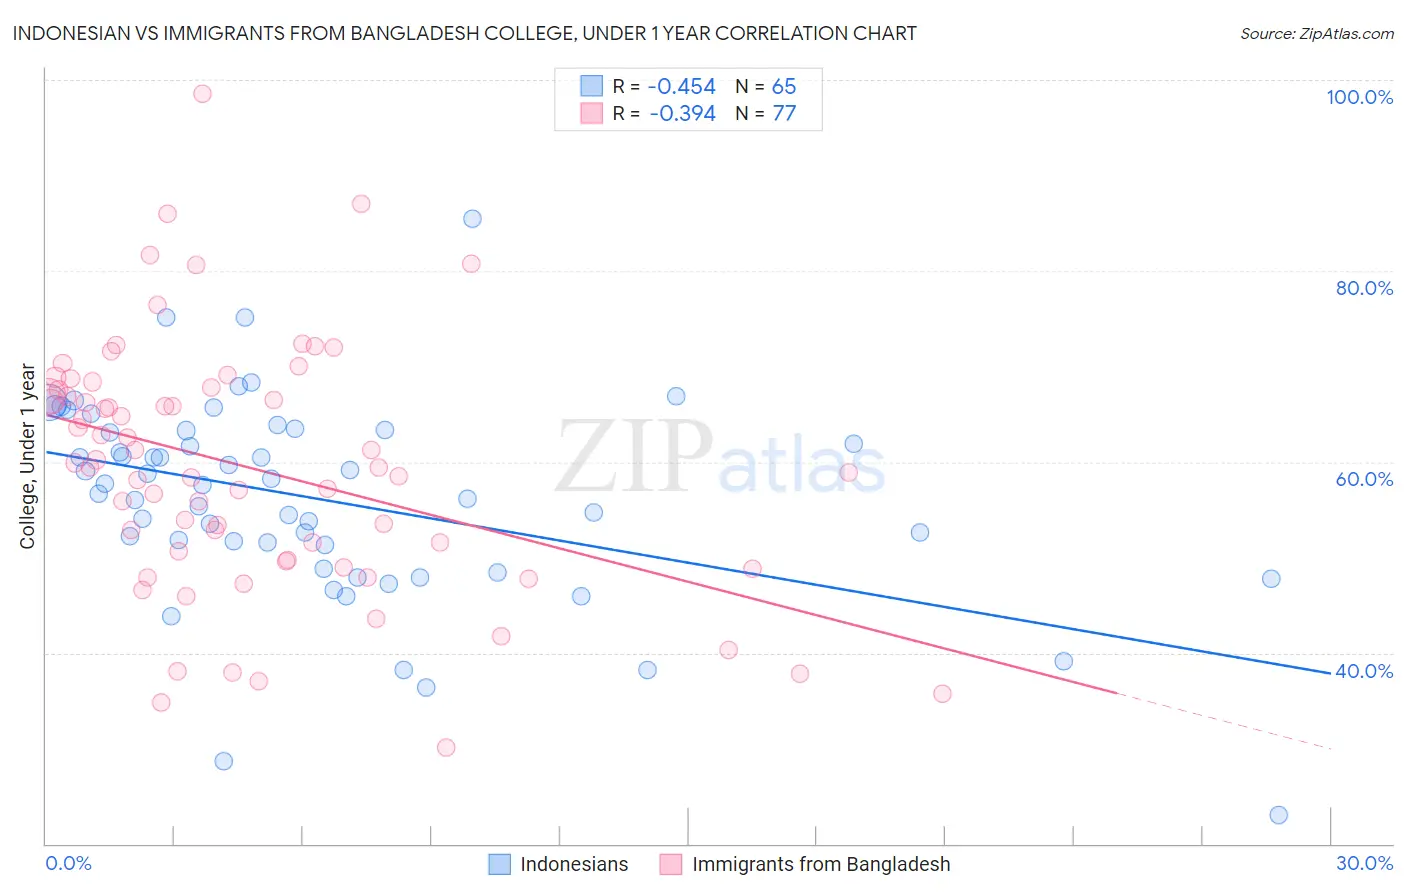
Indonesian vs Immigrants from Bangladesh College, Under 1 year Correlation Chart
The statistical analysis conducted on geographies consisting of 162,726,213 people shows a moderate negative correlation between the proportion of Indonesians and percentage of population with at least college, under 1 year education in the United States with a correlation coefficient (R) of -0.454 and weighted average of 61.2%. Similarly, the statistical analysis conducted on geographies consisting of 203,680,658 people shows a mild negative correlation between the proportion of Immigrants from Bangladesh and percentage of population with at least college, under 1 year education in the United States with a correlation coefficient (R) of -0.394 and weighted average of 61.3%, a difference of 0.020%.
College, Under 1 year Correlation Summary
| Measurement | Indonesian | Immigrants from Bangladesh |
| Minimum | 23.1% | 30.1% |
| Maximum | 85.5% | 98.6% |
| Range | 62.4% | 68.5% |
| Mean | 56.1% | 59.4% |
| Median | 57.6% | 59.4% |
| Interquartile 25% (IQ1) | 50.0% | 49.6% |
| Interquartile 75% (IQ3) | 63.3% | 67.7% |
| Interquartile Range (IQR) | 13.3% | 18.1% |
| Standard Deviation (Sample) | 10.7% | 13.2% |
| Standard Deviation (Population) | 10.6% | 13.1% |
Demographics Similar to Indonesians and Immigrants from Bangladesh by College, Under 1 year
In terms of college, under 1 year, the demographic groups most similar to Indonesians are Immigrants from Laos (61.3%, a difference of 0.080%), Blackfeet (61.1%, a difference of 0.17%), Bangladeshi (61.4%, a difference of 0.20%), African (61.1%, a difference of 0.20%), and Comanche (61.4%, a difference of 0.24%). Similarly, the demographic groups most similar to Immigrants from Bangladesh are Immigrants from Laos (61.3%, a difference of 0.060%), Bangladeshi (61.4%, a difference of 0.17%), Blackfeet (61.1%, a difference of 0.19%), Comanche (61.4%, a difference of 0.22%), and African (61.1%, a difference of 0.22%).
| Demographics | Rating | Rank | College, Under 1 year |
| Potawatomi | 0.6 /100 | #248 | Tragic 61.8% |
| Vietnamese | 0.5 /100 | #249 | Tragic 61.7% |
| Immigrants | Congo | 0.5 /100 | #250 | Tragic 61.7% |
| Immigrants | Micronesia | 0.5 /100 | #251 | Tragic 61.5% |
| West Indians | 0.4 /100 | #252 | Tragic 61.5% |
| Japanese | 0.4 /100 | #253 | Tragic 61.5% |
| Immigrants | Cambodia | 0.4 /100 | #254 | Tragic 61.5% |
| Comanche | 0.4 /100 | #255 | Tragic 61.4% |
| Bangladeshis | 0.4 /100 | #256 | Tragic 61.4% |
| Immigrants | Laos | 0.3 /100 | #257 | Tragic 61.3% |
| Immigrants | Bangladesh | 0.3 /100 | #258 | Tragic 61.3% |
| Indonesians | 0.3 /100 | #259 | Tragic 61.2% |
| Blackfeet | 0.3 /100 | #260 | Tragic 61.1% |
| Africans | 0.3 /100 | #261 | Tragic 61.1% |
| Barbadians | 0.2 /100 | #262 | Tragic 61.1% |
| Shoshone | 0.2 /100 | #263 | Tragic 61.1% |
| Trinidadians and Tobagonians | 0.2 /100 | #264 | Tragic 61.1% |
| Immigrants | Bahamas | 0.2 /100 | #265 | Tragic 61.1% |
| Alaskan Athabascans | 0.2 /100 | #266 | Tragic 61.0% |
| Americans | 0.2 /100 | #267 | Tragic 61.0% |
| Immigrants | Trinidad and Tobago | 0.1 /100 | #268 | Tragic 60.7% |