Immigrants from the Azores vs Immigrants from Bangladesh College, Under 1 year
COMPARE
Immigrants from the Azores
Immigrants from Bangladesh
College, Under 1 year
College, Under 1 year Comparison
Immigrants from the Azores
Immigrants from Bangladesh
54.7%
COLLEGE, UNDER 1 YEAR
0.0/ 100
METRIC RATING
334th/ 347
METRIC RANK
61.3%
COLLEGE, UNDER 1 YEAR
0.3/ 100
METRIC RATING
258th/ 347
METRIC RANK
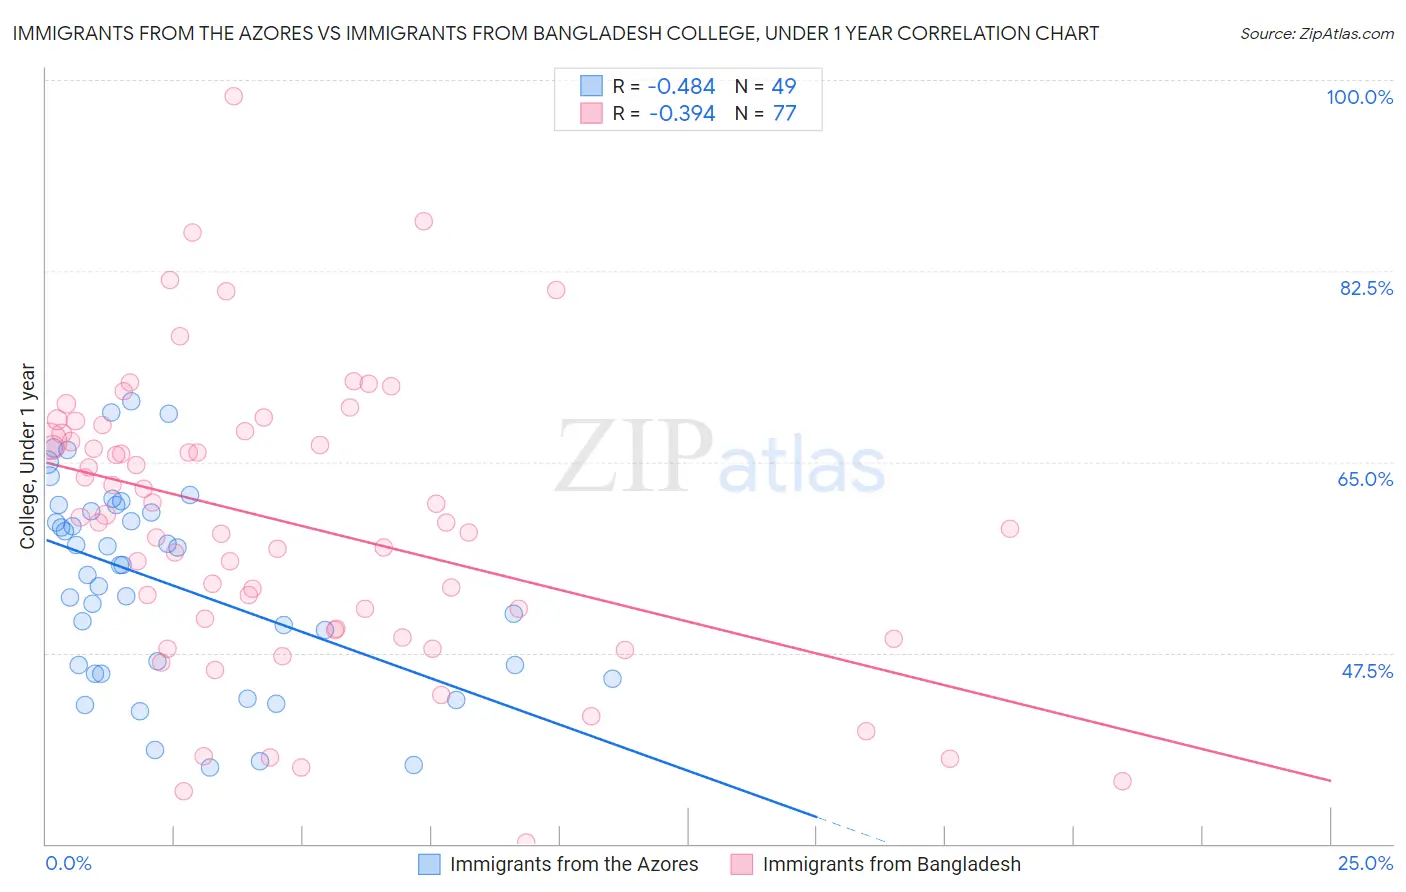
Immigrants from the Azores vs Immigrants from Bangladesh College, Under 1 year Correlation Chart
The statistical analysis conducted on geographies consisting of 46,257,310 people shows a moderate negative correlation between the proportion of Immigrants from the Azores and percentage of population with at least college, under 1 year education in the United States with a correlation coefficient (R) of -0.484 and weighted average of 54.7%. Similarly, the statistical analysis conducted on geographies consisting of 203,680,658 people shows a mild negative correlation between the proportion of Immigrants from Bangladesh and percentage of population with at least college, under 1 year education in the United States with a correlation coefficient (R) of -0.394 and weighted average of 61.3%, a difference of 12.0%.
College, Under 1 year Correlation Summary
| Measurement | Immigrants from the Azores | Immigrants from Bangladesh |
| Minimum | 36.9% | 30.1% |
| Maximum | 70.6% | 98.6% |
| Range | 33.6% | 68.5% |
| Mean | 53.9% | 59.4% |
| Median | 55.6% | 59.4% |
| Interquartile 25% (IQ1) | 46.0% | 49.6% |
| Interquartile 75% (IQ3) | 60.8% | 67.7% |
| Interquartile Range (IQR) | 14.8% | 18.1% |
| Standard Deviation (Sample) | 9.1% | 13.2% |
| Standard Deviation (Population) | 9.0% | 13.1% |
Similar Demographics by College, Under 1 year
Demographics Similar to Immigrants from the Azores by College, Under 1 year
In terms of college, under 1 year, the demographic groups most similar to Immigrants from the Azores are Inupiat (54.6%, a difference of 0.13%), Pennsylvania German (54.5%, a difference of 0.30%), Immigrants from Central America (54.4%, a difference of 0.45%), Yuman (55.1%, a difference of 0.72%), and Lumbee (54.2%, a difference of 0.86%).
| Demographics | Rating | Rank | College, Under 1 year |
| Immigrants | Guatemala | 0.0 /100 | #327 | Tragic 56.2% |
| Cape Verdeans | 0.0 /100 | #328 | Tragic 56.0% |
| Immigrants | Cuba | 0.0 /100 | #329 | Tragic 55.7% |
| Mexicans | 0.0 /100 | #330 | Tragic 55.6% |
| Dominicans | 0.0 /100 | #331 | Tragic 55.5% |
| Immigrants | Yemen | 0.0 /100 | #332 | Tragic 55.3% |
| Yuman | 0.0 /100 | #333 | Tragic 55.1% |
| Immigrants | Azores | 0.0 /100 | #334 | Tragic 54.7% |
| Inupiat | 0.0 /100 | #335 | Tragic 54.6% |
| Pennsylvania Germans | 0.0 /100 | #336 | Tragic 54.5% |
| Immigrants | Central America | 0.0 /100 | #337 | Tragic 54.4% |
| Lumbee | 0.0 /100 | #338 | Tragic 54.2% |
| Immigrants | Dominican Republic | 0.0 /100 | #339 | Tragic 54.0% |
| Spanish American Indians | 0.0 /100 | #340 | Tragic 54.0% |
| Immigrants | Cabo Verde | 0.0 /100 | #341 | Tragic 53.7% |
Demographics Similar to Immigrants from Bangladesh by College, Under 1 year
In terms of college, under 1 year, the demographic groups most similar to Immigrants from Bangladesh are Indonesian (61.2%, a difference of 0.020%), Immigrants from Laos (61.3%, a difference of 0.060%), Bangladeshi (61.4%, a difference of 0.17%), Blackfeet (61.1%, a difference of 0.19%), and Comanche (61.4%, a difference of 0.22%).
| Demographics | Rating | Rank | College, Under 1 year |
| Immigrants | Micronesia | 0.5 /100 | #251 | Tragic 61.5% |
| West Indians | 0.4 /100 | #252 | Tragic 61.5% |
| Japanese | 0.4 /100 | #253 | Tragic 61.5% |
| Immigrants | Cambodia | 0.4 /100 | #254 | Tragic 61.5% |
| Comanche | 0.4 /100 | #255 | Tragic 61.4% |
| Bangladeshis | 0.4 /100 | #256 | Tragic 61.4% |
| Immigrants | Laos | 0.3 /100 | #257 | Tragic 61.3% |
| Immigrants | Bangladesh | 0.3 /100 | #258 | Tragic 61.3% |
| Indonesians | 0.3 /100 | #259 | Tragic 61.2% |
| Blackfeet | 0.3 /100 | #260 | Tragic 61.1% |
| Africans | 0.3 /100 | #261 | Tragic 61.1% |
| Barbadians | 0.2 /100 | #262 | Tragic 61.1% |
| Shoshone | 0.2 /100 | #263 | Tragic 61.1% |
| Trinidadians and Tobagonians | 0.2 /100 | #264 | Tragic 61.1% |
| Immigrants | Bahamas | 0.2 /100 | #265 | Tragic 61.1% |