Immigrants from Bolivia vs Immigrants from Bangladesh College, Under 1 year
COMPARE
Immigrants from Bolivia
Immigrants from Bangladesh
College, Under 1 year
College, Under 1 year Comparison
Immigrants from Bolivia
Immigrants from Bangladesh
67.9%
COLLEGE, UNDER 1 YEAR
97.0/ 100
METRIC RATING
99th/ 347
METRIC RANK
61.3%
COLLEGE, UNDER 1 YEAR
0.3/ 100
METRIC RATING
258th/ 347
METRIC RANK
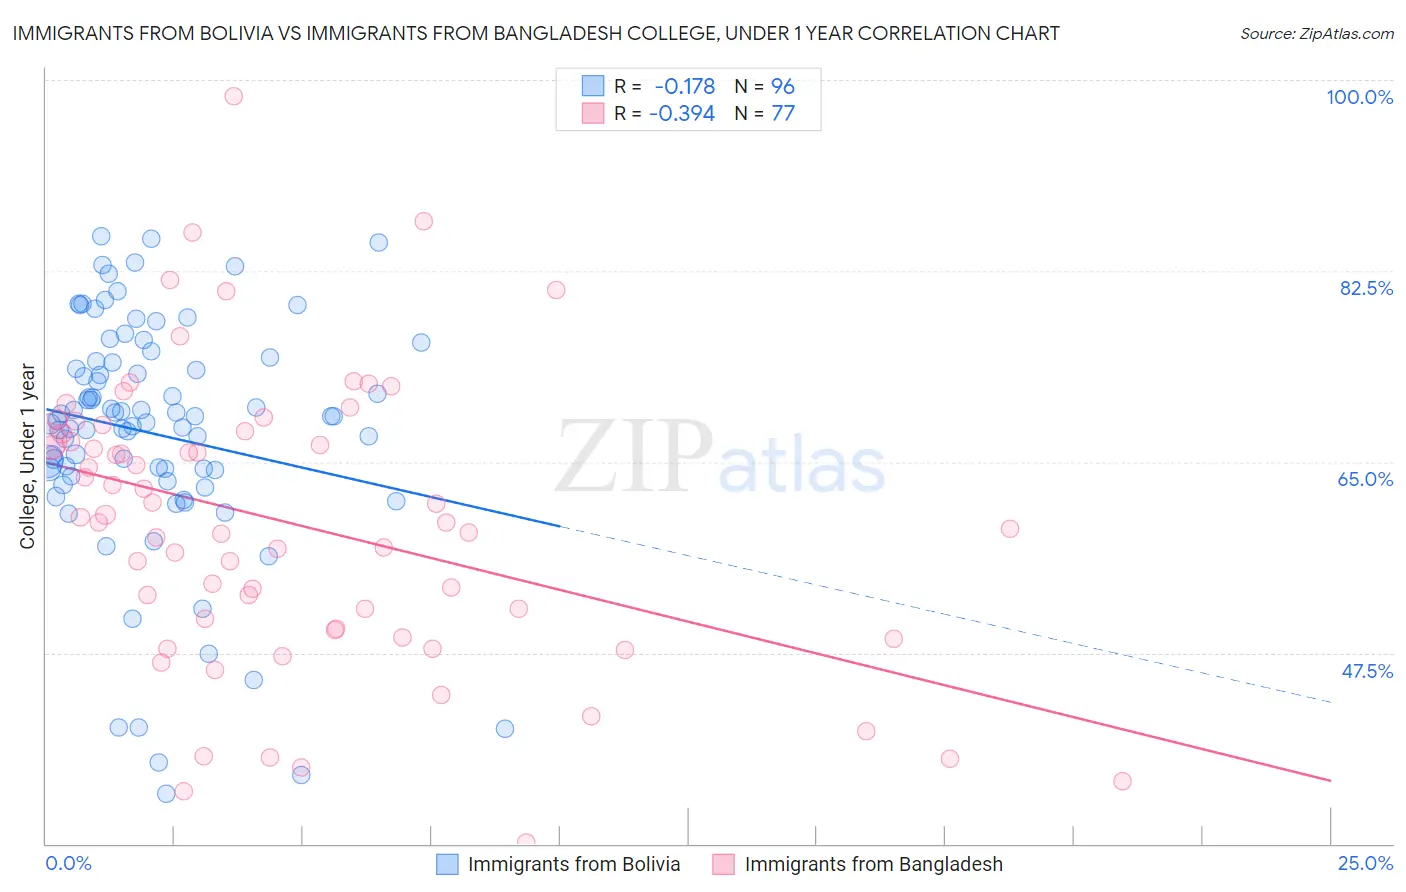
Immigrants from Bolivia vs Immigrants from Bangladesh College, Under 1 year Correlation Chart
The statistical analysis conducted on geographies consisting of 158,732,804 people shows a poor negative correlation between the proportion of Immigrants from Bolivia and percentage of population with at least college, under 1 year education in the United States with a correlation coefficient (R) of -0.178 and weighted average of 67.9%. Similarly, the statistical analysis conducted on geographies consisting of 203,680,658 people shows a mild negative correlation between the proportion of Immigrants from Bangladesh and percentage of population with at least college, under 1 year education in the United States with a correlation coefficient (R) of -0.394 and weighted average of 61.3%, a difference of 10.9%.
College, Under 1 year Correlation Summary
| Measurement | Immigrants from Bolivia | Immigrants from Bangladesh |
| Minimum | 34.6% | 30.1% |
| Maximum | 85.6% | 98.6% |
| Range | 51.0% | 68.5% |
| Mean | 67.5% | 59.4% |
| Median | 69.0% | 59.4% |
| Interquartile 25% (IQ1) | 64.0% | 49.6% |
| Interquartile 75% (IQ3) | 74.2% | 67.7% |
| Interquartile Range (IQR) | 10.2% | 18.1% |
| Standard Deviation (Sample) | 11.0% | 13.2% |
| Standard Deviation (Population) | 10.9% | 13.1% |
Similar Demographics by College, Under 1 year
Demographics Similar to Immigrants from Bolivia by College, Under 1 year
In terms of college, under 1 year, the demographic groups most similar to Immigrants from Bolivia are Immigrants from Argentina (67.9%, a difference of 0.010%), Paraguayan (67.9%, a difference of 0.020%), Immigrants from Eastern Europe (67.9%, a difference of 0.060%), Palestinian (67.9%, a difference of 0.060%), and Carpatho Rusyn (67.9%, a difference of 0.070%).
| Demographics | Rating | Rank | College, Under 1 year |
| Luxembourgers | 98.1 /100 | #92 | Exceptional 68.2% |
| Romanians | 97.9 /100 | #93 | Exceptional 68.2% |
| Armenians | 97.7 /100 | #94 | Exceptional 68.1% |
| Immigrants | Pakistan | 97.5 /100 | #95 | Exceptional 68.0% |
| Jordanians | 97.4 /100 | #96 | Exceptional 68.0% |
| Immigrants | Ethiopia | 97.3 /100 | #97 | Exceptional 68.0% |
| Paraguayans | 97.1 /100 | #98 | Exceptional 67.9% |
| Immigrants | Bolivia | 97.0 /100 | #99 | Exceptional 67.9% |
| Immigrants | Argentina | 97.0 /100 | #100 | Exceptional 67.9% |
| Immigrants | Eastern Europe | 96.9 /100 | #101 | Exceptional 67.9% |
| Palestinians | 96.9 /100 | #102 | Exceptional 67.9% |
| Carpatho Rusyns | 96.8 /100 | #103 | Exceptional 67.9% |
| Immigrants | Western Asia | 96.6 /100 | #104 | Exceptional 67.8% |
| Afghans | 96.6 /100 | #105 | Exceptional 67.8% |
| Immigrants | Croatia | 96.6 /100 | #106 | Exceptional 67.8% |
Demographics Similar to Immigrants from Bangladesh by College, Under 1 year
In terms of college, under 1 year, the demographic groups most similar to Immigrants from Bangladesh are Indonesian (61.2%, a difference of 0.020%), Immigrants from Laos (61.3%, a difference of 0.060%), Bangladeshi (61.4%, a difference of 0.17%), Blackfeet (61.1%, a difference of 0.19%), and Comanche (61.4%, a difference of 0.22%).
| Demographics | Rating | Rank | College, Under 1 year |
| Immigrants | Micronesia | 0.5 /100 | #251 | Tragic 61.5% |
| West Indians | 0.4 /100 | #252 | Tragic 61.5% |
| Japanese | 0.4 /100 | #253 | Tragic 61.5% |
| Immigrants | Cambodia | 0.4 /100 | #254 | Tragic 61.5% |
| Comanche | 0.4 /100 | #255 | Tragic 61.4% |
| Bangladeshis | 0.4 /100 | #256 | Tragic 61.4% |
| Immigrants | Laos | 0.3 /100 | #257 | Tragic 61.3% |
| Immigrants | Bangladesh | 0.3 /100 | #258 | Tragic 61.3% |
| Indonesians | 0.3 /100 | #259 | Tragic 61.2% |
| Blackfeet | 0.3 /100 | #260 | Tragic 61.1% |
| Africans | 0.3 /100 | #261 | Tragic 61.1% |
| Barbadians | 0.2 /100 | #262 | Tragic 61.1% |
| Shoshone | 0.2 /100 | #263 | Tragic 61.1% |
| Trinidadians and Tobagonians | 0.2 /100 | #264 | Tragic 61.1% |
| Immigrants | Bahamas | 0.2 /100 | #265 | Tragic 61.1% |