Immigrants from St. Vincent and the Grenadines vs Immigrants from Mexico College, Under 1 year
COMPARE
Immigrants from St. Vincent and the Grenadines
Immigrants from Mexico
College, Under 1 year
College, Under 1 year Comparison
Immigrants from St. Vincent and the Grenadines
Immigrants from Mexico
59.6%
COLLEGE, UNDER 1 YEAR
0.0/ 100
METRIC RATING
284th/ 347
METRIC RANK
53.7%
COLLEGE, UNDER 1 YEAR
0.0/ 100
METRIC RATING
342nd/ 347
METRIC RANK
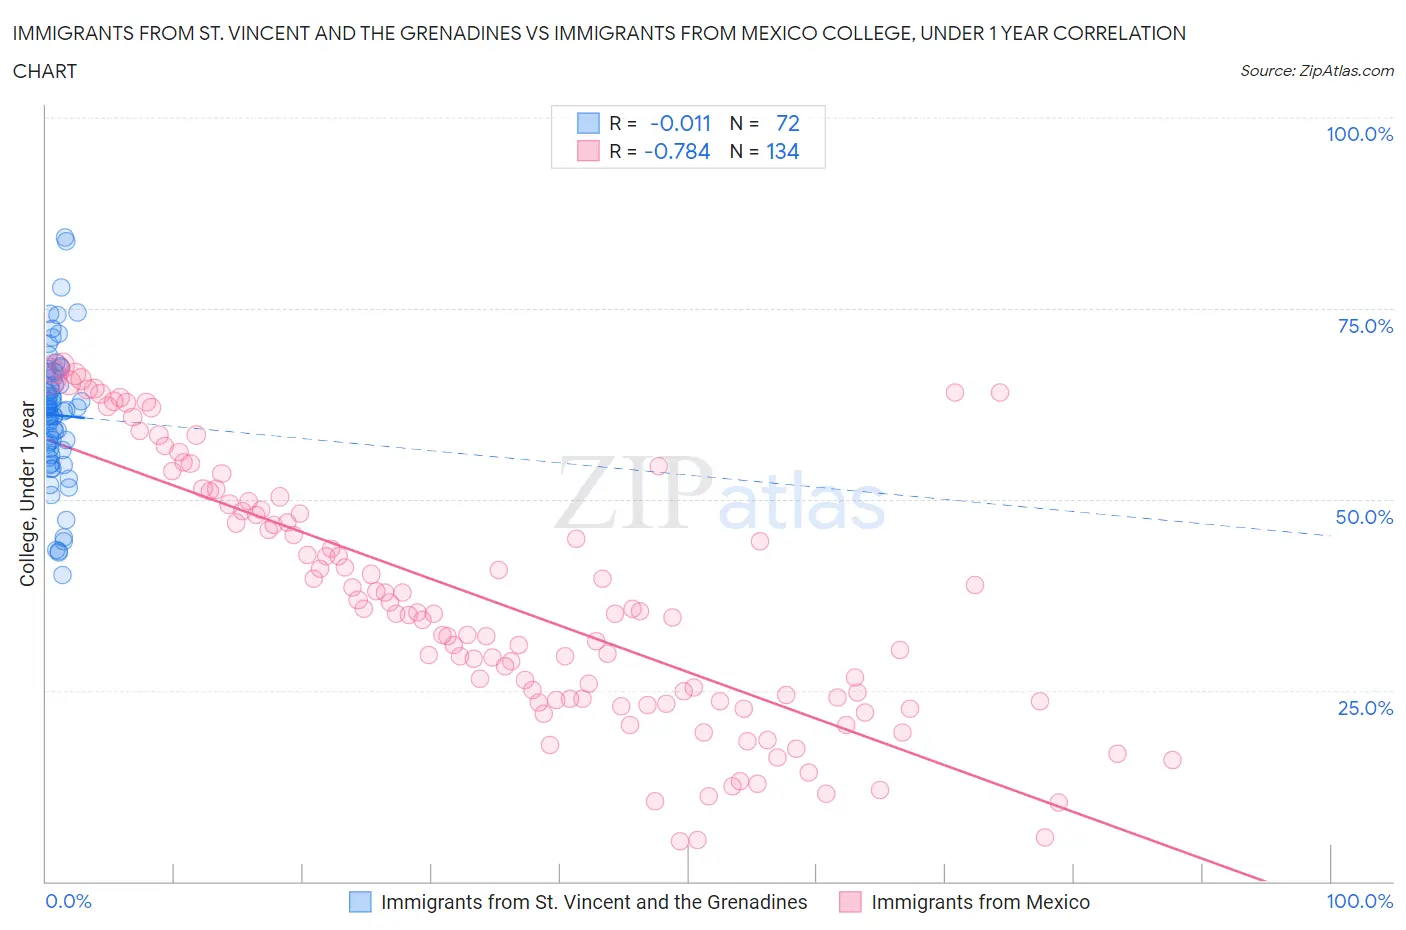
Immigrants from St. Vincent and the Grenadines vs Immigrants from Mexico College, Under 1 year Correlation Chart
The statistical analysis conducted on geographies consisting of 56,185,220 people shows no correlation between the proportion of Immigrants from St. Vincent and the Grenadines and percentage of population with at least college, under 1 year education in the United States with a correlation coefficient (R) of -0.011 and weighted average of 59.6%. Similarly, the statistical analysis conducted on geographies consisting of 513,757,474 people shows a strong negative correlation between the proportion of Immigrants from Mexico and percentage of population with at least college, under 1 year education in the United States with a correlation coefficient (R) of -0.784 and weighted average of 53.7%, a difference of 11.2%.
College, Under 1 year Correlation Summary
| Measurement | Immigrants from St. Vincent and the Grenadines | Immigrants from Mexico |
| Minimum | 40.2% | 5.3% |
| Maximum | 84.3% | 67.5% |
| Range | 44.1% | 62.2% |
| Mean | 61.0% | 36.8% |
| Median | 61.7% | 35.1% |
| Interquartile 25% (IQ1) | 56.1% | 23.8% |
| Interquartile 75% (IQ3) | 66.3% | 49.4% |
| Interquartile Range (IQR) | 10.1% | 25.6% |
| Standard Deviation (Sample) | 8.9% | 16.6% |
| Standard Deviation (Population) | 8.8% | 16.5% |
Similar Demographics by College, Under 1 year
Demographics Similar to Immigrants from St. Vincent and the Grenadines by College, Under 1 year
In terms of college, under 1 year, the demographic groups most similar to Immigrants from St. Vincent and the Grenadines are Paiute (59.6%, a difference of 0.010%), Immigrants from Jamaica (59.7%, a difference of 0.11%), British West Indian (59.5%, a difference of 0.15%), Sioux (59.4%, a difference of 0.32%), and Black/African American (59.4%, a difference of 0.42%).
| Demographics | Rating | Rank | College, Under 1 year |
| Bahamians | 0.1 /100 | #277 | Tragic 60.3% |
| Yaqui | 0.1 /100 | #278 | Tragic 60.2% |
| Ute | 0.1 /100 | #279 | Tragic 60.2% |
| Crow | 0.1 /100 | #280 | Tragic 60.2% |
| Cherokee | 0.1 /100 | #281 | Tragic 60.1% |
| Belizeans | 0.1 /100 | #282 | Tragic 60.1% |
| Immigrants | Jamaica | 0.0 /100 | #283 | Tragic 59.7% |
| Immigrants | St. Vincent and the Grenadines | 0.0 /100 | #284 | Tragic 59.6% |
| Paiute | 0.0 /100 | #285 | Tragic 59.6% |
| British West Indians | 0.0 /100 | #286 | Tragic 59.5% |
| Sioux | 0.0 /100 | #287 | Tragic 59.4% |
| Blacks/African Americans | 0.0 /100 | #288 | Tragic 59.4% |
| Choctaw | 0.0 /100 | #289 | Tragic 59.3% |
| Ecuadorians | 0.0 /100 | #290 | Tragic 59.3% |
| Creek | 0.0 /100 | #291 | Tragic 59.3% |
Demographics Similar to Immigrants from Mexico by College, Under 1 year
In terms of college, under 1 year, the demographic groups most similar to Immigrants from Mexico are Immigrants from Cabo Verde (53.7%, a difference of 0.060%), Spanish American Indian (54.0%, a difference of 0.57%), Immigrants from Dominican Republic (54.0%, a difference of 0.65%), Lumbee (54.2%, a difference of 1.1%), and Immigrants from Central America (54.4%, a difference of 1.5%).
| Demographics | Rating | Rank | College, Under 1 year |
| Yuman | 0.0 /100 | #333 | Tragic 55.1% |
| Immigrants | Azores | 0.0 /100 | #334 | Tragic 54.7% |
| Inupiat | 0.0 /100 | #335 | Tragic 54.6% |
| Pennsylvania Germans | 0.0 /100 | #336 | Tragic 54.5% |
| Immigrants | Central America | 0.0 /100 | #337 | Tragic 54.4% |
| Lumbee | 0.0 /100 | #338 | Tragic 54.2% |
| Immigrants | Dominican Republic | 0.0 /100 | #339 | Tragic 54.0% |
| Spanish American Indians | 0.0 /100 | #340 | Tragic 54.0% |
| Immigrants | Cabo Verde | 0.0 /100 | #341 | Tragic 53.7% |
| Immigrants | Mexico | 0.0 /100 | #342 | Tragic 53.7% |
| Tohono O'odham | 0.0 /100 | #343 | Tragic 52.8% |
| Yakama | 0.0 /100 | #344 | Tragic 52.6% |
| Pima | 0.0 /100 | #345 | Tragic 51.4% |
| Houma | 0.0 /100 | #346 | Tragic 47.6% |
| Yup'ik | 0.0 /100 | #347 | Tragic 45.8% |