Immigrants from St. Vincent and the Grenadines vs Polish College, 1 year or more
COMPARE
Immigrants from St. Vincent and the Grenadines
Polish
College, 1 year or more
College, 1 year or more Comparison
Immigrants from St. Vincent and the Grenadines
Poles
54.8%
COLLEGE, 1 YEAR OR MORE
0.3/ 100
METRIC RATING
262nd/ 347
METRIC RANK
60.7%
COLLEGE, 1 YEAR OR MORE
82.8/ 100
METRIC RATING
142nd/ 347
METRIC RANK
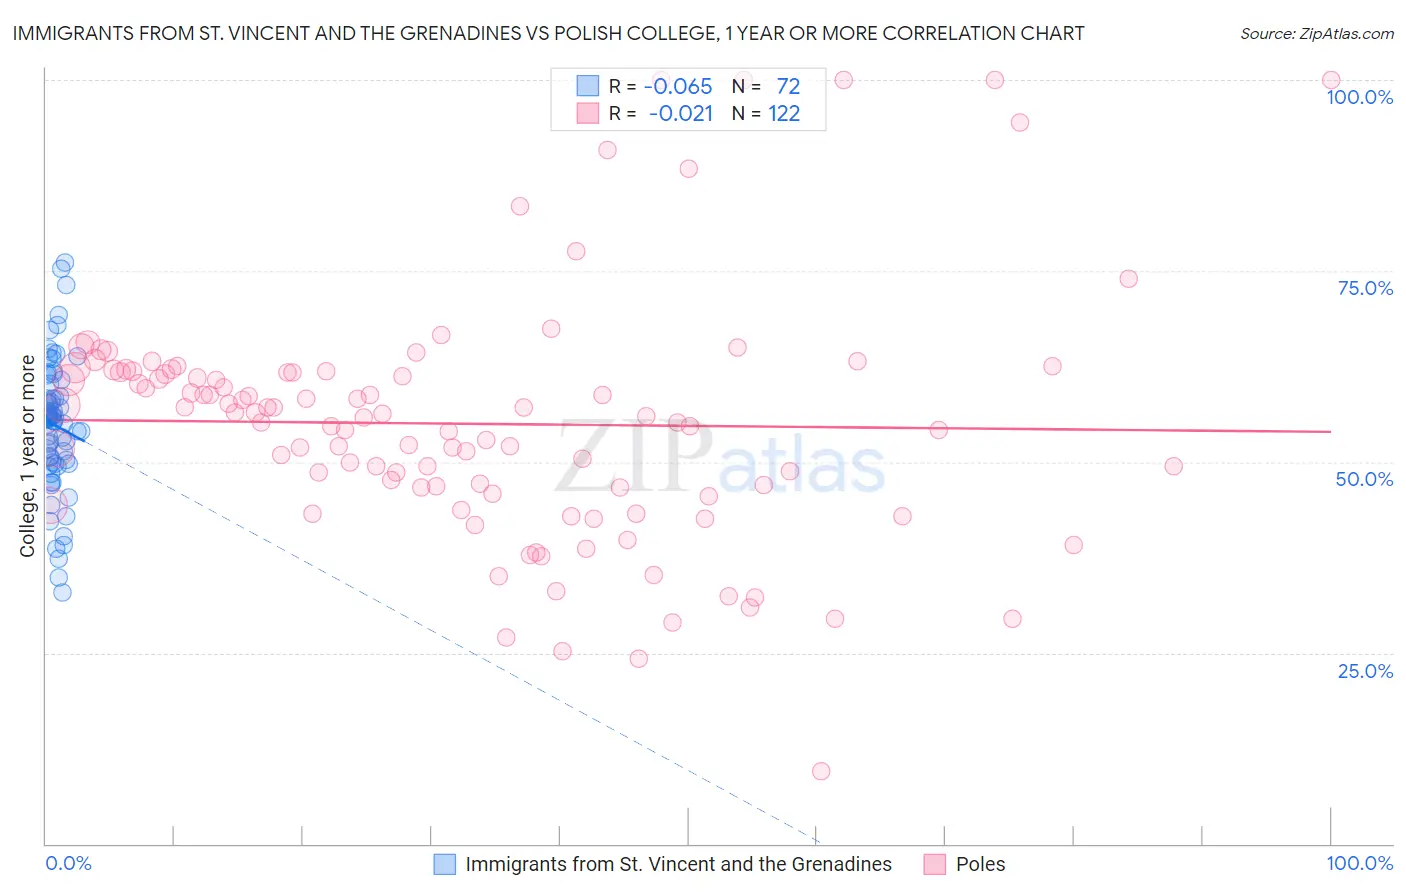
Immigrants from St. Vincent and the Grenadines vs Polish College, 1 year or more Correlation Chart
The statistical analysis conducted on geographies consisting of 56,185,220 people shows a slight negative correlation between the proportion of Immigrants from St. Vincent and the Grenadines and percentage of population with at least college, 1 year or more education in the United States with a correlation coefficient (R) of -0.065 and weighted average of 54.8%. Similarly, the statistical analysis conducted on geographies consisting of 560,585,948 people shows no correlation between the proportion of Poles and percentage of population with at least college, 1 year or more education in the United States with a correlation coefficient (R) of -0.021 and weighted average of 60.7%, a difference of 10.7%.
College, 1 year or more Correlation Summary
| Measurement | Immigrants from St. Vincent and the Grenadines | Polish |
| Minimum | 33.0% | 9.5% |
| Maximum | 76.2% | 100.0% |
| Range | 43.2% | 90.5% |
| Mean | 54.8% | 55.0% |
| Median | 55.6% | 55.9% |
| Interquartile 25% (IQ1) | 49.8% | 46.6% |
| Interquartile 75% (IQ3) | 59.3% | 61.7% |
| Interquartile Range (IQR) | 9.5% | 15.1% |
| Standard Deviation (Sample) | 8.8% | 16.1% |
| Standard Deviation (Population) | 8.7% | 16.0% |
Similar Demographics by College, 1 year or more
Demographics Similar to Immigrants from St. Vincent and the Grenadines by College, 1 year or more
In terms of college, 1 year or more, the demographic groups most similar to Immigrants from St. Vincent and the Grenadines are U.S. Virgin Islander (54.8%, a difference of 0.020%), Immigrants from Micronesia (54.8%, a difference of 0.050%), Ottawa (54.9%, a difference of 0.080%), Jamaican (54.9%, a difference of 0.11%), and Nepalese (54.9%, a difference of 0.21%).
| Demographics | Rating | Rank | College, 1 year or more |
| Immigrants | Bahamas | 0.5 /100 | #255 | Tragic 55.2% |
| Immigrants | West Indies | 0.5 /100 | #256 | Tragic 55.2% |
| Indonesians | 0.4 /100 | #257 | Tragic 55.1% |
| Africans | 0.4 /100 | #258 | Tragic 55.0% |
| Nepalese | 0.3 /100 | #259 | Tragic 54.9% |
| Jamaicans | 0.3 /100 | #260 | Tragic 54.9% |
| Ottawa | 0.3 /100 | #261 | Tragic 54.9% |
| Immigrants | St. Vincent and the Grenadines | 0.3 /100 | #262 | Tragic 54.8% |
| U.S. Virgin Islanders | 0.3 /100 | #263 | Tragic 54.8% |
| Immigrants | Micronesia | 0.3 /100 | #264 | Tragic 54.8% |
| Immigrants | Laos | 0.2 /100 | #265 | Tragic 54.7% |
| Potawatomi | 0.2 /100 | #266 | Tragic 54.6% |
| Blackfeet | 0.2 /100 | #267 | Tragic 54.6% |
| British West Indians | 0.2 /100 | #268 | Tragic 54.5% |
| Bangladeshis | 0.2 /100 | #269 | Tragic 54.5% |
Demographics Similar to Poles by College, 1 year or more
In terms of college, 1 year or more, the demographic groups most similar to Poles are Canadian (60.6%, a difference of 0.010%), Immigrants from Afghanistan (60.7%, a difference of 0.030%), Iraqi (60.7%, a difference of 0.050%), Czech (60.6%, a difference of 0.080%), and Immigrants from Eritrea (60.7%, a difference of 0.14%).
| Demographics | Rating | Rank | College, 1 year or more |
| Immigrants | Uganda | 87.4 /100 | #135 | Excellent 60.9% |
| Basques | 87.2 /100 | #136 | Excellent 60.9% |
| Slovenes | 86.5 /100 | #137 | Excellent 60.9% |
| Taiwanese | 84.3 /100 | #138 | Excellent 60.7% |
| Immigrants | Eritrea | 84.3 /100 | #139 | Excellent 60.7% |
| Iraqis | 83.3 /100 | #140 | Excellent 60.7% |
| Immigrants | Afghanistan | 83.1 /100 | #141 | Excellent 60.7% |
| Poles | 82.8 /100 | #142 | Excellent 60.7% |
| Canadians | 82.7 /100 | #143 | Excellent 60.6% |
| Czechs | 81.9 /100 | #144 | Excellent 60.6% |
| Slavs | 81.1 /100 | #145 | Excellent 60.6% |
| Scottish | 80.2 /100 | #146 | Excellent 60.5% |
| Immigrants | Kenya | 79.1 /100 | #147 | Good 60.5% |
| Kenyans | 79.0 /100 | #148 | Good 60.5% |
| Brazilians | 79.0 /100 | #149 | Good 60.5% |