Immigrants from Sri Lanka vs Puerto Rican College, Under 1 year
COMPARE
Immigrants from Sri Lanka
Puerto Rican
College, Under 1 year
College, Under 1 year Comparison
Immigrants from Sri Lanka
Puerto Ricans
70.5%
COLLEGE, UNDER 1 YEAR
99.9/ 100
METRIC RATING
36th/ 347
METRIC RANK
56.8%
COLLEGE, UNDER 1 YEAR
0.0/ 100
METRIC RATING
319th/ 347
METRIC RANK
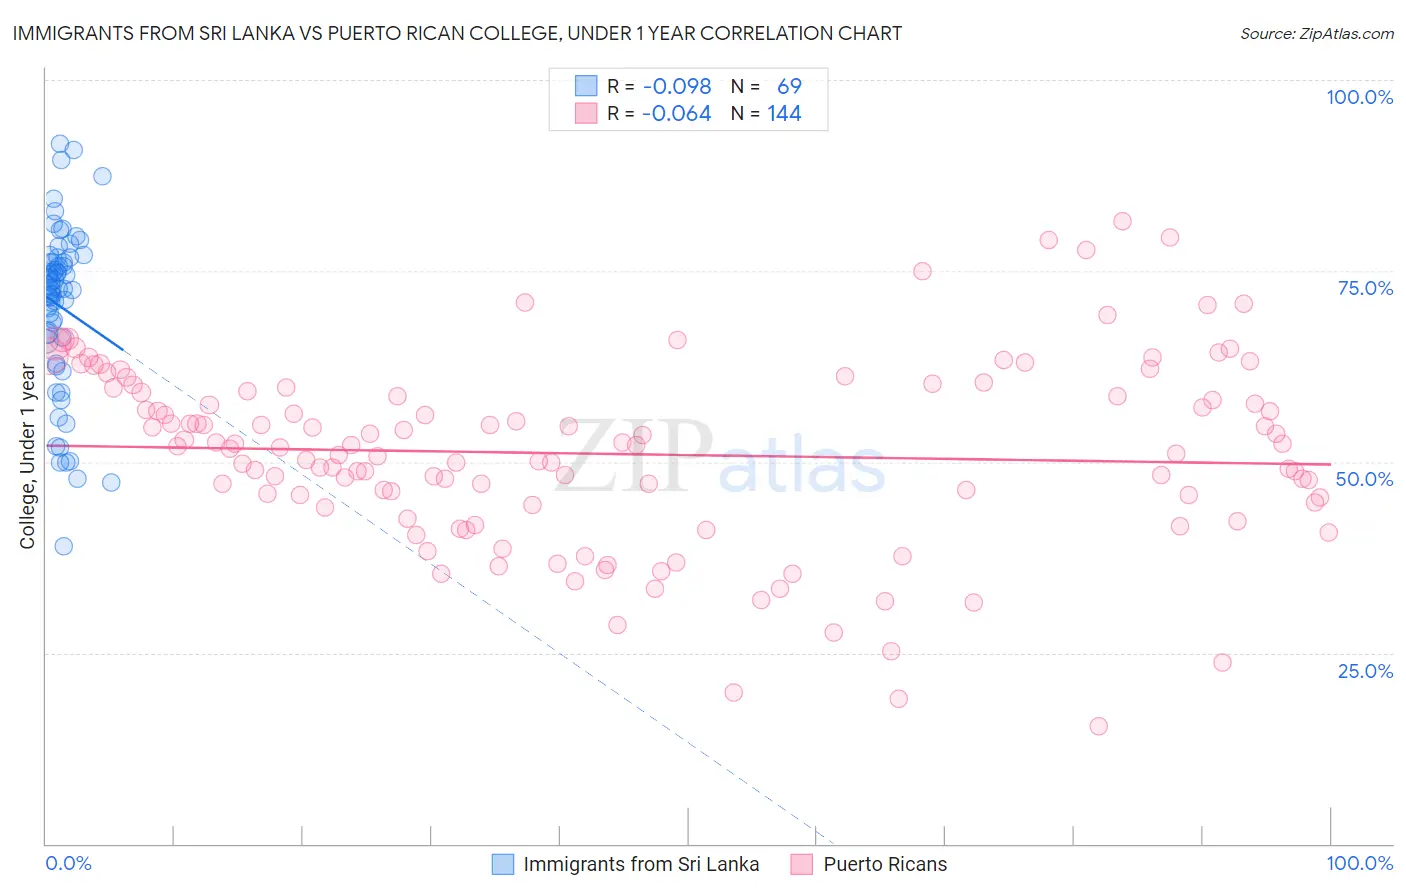
Immigrants from Sri Lanka vs Puerto Rican College, Under 1 year Correlation Chart
The statistical analysis conducted on geographies consisting of 149,700,552 people shows a slight negative correlation between the proportion of Immigrants from Sri Lanka and percentage of population with at least college, under 1 year education in the United States with a correlation coefficient (R) of -0.098 and weighted average of 70.5%. Similarly, the statistical analysis conducted on geographies consisting of 528,317,754 people shows a slight negative correlation between the proportion of Puerto Ricans and percentage of population with at least college, under 1 year education in the United States with a correlation coefficient (R) of -0.064 and weighted average of 56.8%, a difference of 24.0%.
College, Under 1 year Correlation Summary
| Measurement | Immigrants from Sri Lanka | Puerto Rican |
| Minimum | 38.9% | 15.4% |
| Maximum | 91.7% | 81.5% |
| Range | 52.8% | 66.1% |
| Mean | 70.4% | 51.0% |
| Median | 72.6% | 52.0% |
| Interquartile 25% (IQ1) | 66.0% | 44.5% |
| Interquartile 75% (IQ3) | 76.4% | 59.2% |
| Interquartile Range (IQR) | 10.4% | 14.7% |
| Standard Deviation (Sample) | 10.9% | 12.2% |
| Standard Deviation (Population) | 10.8% | 12.2% |
Similar Demographics by College, Under 1 year
Demographics Similar to Immigrants from Sri Lanka by College, Under 1 year
In terms of college, under 1 year, the demographic groups most similar to Immigrants from Sri Lanka are Russian (70.5%, a difference of 0.060%), Immigrants from Saudi Arabia (70.4%, a difference of 0.11%), Estonian (70.6%, a difference of 0.15%), Immigrants from South Africa (70.6%, a difference of 0.16%), and Australian (70.4%, a difference of 0.18%).
| Demographics | Rating | Rank | College, Under 1 year |
| Immigrants | France | 100.0 /100 | #29 | Exceptional 71.0% |
| Immigrants | China | 99.9 /100 | #30 | Exceptional 70.9% |
| Indians (Asian) | 99.9 /100 | #31 | Exceptional 70.8% |
| Turks | 99.9 /100 | #32 | Exceptional 70.7% |
| Immigrants | South Africa | 99.9 /100 | #33 | Exceptional 70.6% |
| Estonians | 99.9 /100 | #34 | Exceptional 70.6% |
| Russians | 99.9 /100 | #35 | Exceptional 70.5% |
| Immigrants | Sri Lanka | 99.9 /100 | #36 | Exceptional 70.5% |
| Immigrants | Saudi Arabia | 99.9 /100 | #37 | Exceptional 70.4% |
| Australians | 99.9 /100 | #38 | Exceptional 70.4% |
| Bhutanese | 99.9 /100 | #39 | Exceptional 70.3% |
| Immigrants | Turkey | 99.9 /100 | #40 | Exceptional 70.3% |
| Immigrants | Kuwait | 99.9 /100 | #41 | Exceptional 70.3% |
| Immigrants | Lithuania | 99.9 /100 | #42 | Exceptional 70.3% |
| Israelis | 99.9 /100 | #43 | Exceptional 70.2% |
Demographics Similar to Puerto Ricans by College, Under 1 year
In terms of college, under 1 year, the demographic groups most similar to Puerto Ricans are Guatemalan (56.8%, a difference of 0.060%), Immigrants from Haiti (56.9%, a difference of 0.20%), Hispanic or Latino (57.0%, a difference of 0.32%), Native/Alaskan (56.6%, a difference of 0.32%), and Menominee (57.0%, a difference of 0.36%).
| Demographics | Rating | Rank | College, Under 1 year |
| Salvadorans | 0.0 /100 | #312 | Tragic 57.3% |
| Dutch West Indians | 0.0 /100 | #313 | Tragic 57.2% |
| Hopi | 0.0 /100 | #314 | Tragic 57.1% |
| Hondurans | 0.0 /100 | #315 | Tragic 57.1% |
| Menominee | 0.0 /100 | #316 | Tragic 57.0% |
| Hispanics or Latinos | 0.0 /100 | #317 | Tragic 57.0% |
| Immigrants | Haiti | 0.0 /100 | #318 | Tragic 56.9% |
| Puerto Ricans | 0.0 /100 | #319 | Tragic 56.8% |
| Guatemalans | 0.0 /100 | #320 | Tragic 56.8% |
| Natives/Alaskans | 0.0 /100 | #321 | Tragic 56.6% |
| Immigrants | Caribbean | 0.0 /100 | #322 | Tragic 56.6% |
| Immigrants | Honduras | 0.0 /100 | #323 | Tragic 56.5% |
| Immigrants | El Salvador | 0.0 /100 | #324 | Tragic 56.4% |
| Immigrants | Latin America | 0.0 /100 | #325 | Tragic 56.3% |
| Navajo | 0.0 /100 | #326 | Tragic 56.3% |