Immigrants from Sri Lanka vs Immigrants from Brazil College, Under 1 year
COMPARE
Immigrants from Sri Lanka
Immigrants from Brazil
College, Under 1 year
College, Under 1 year Comparison
Immigrants from Sri Lanka
Immigrants from Brazil
70.5%
COLLEGE, UNDER 1 YEAR
99.9/ 100
METRIC RATING
36th/ 347
METRIC RANK
66.9%
COLLEGE, UNDER 1 YEAR
88.3/ 100
METRIC RATING
133rd/ 347
METRIC RANK
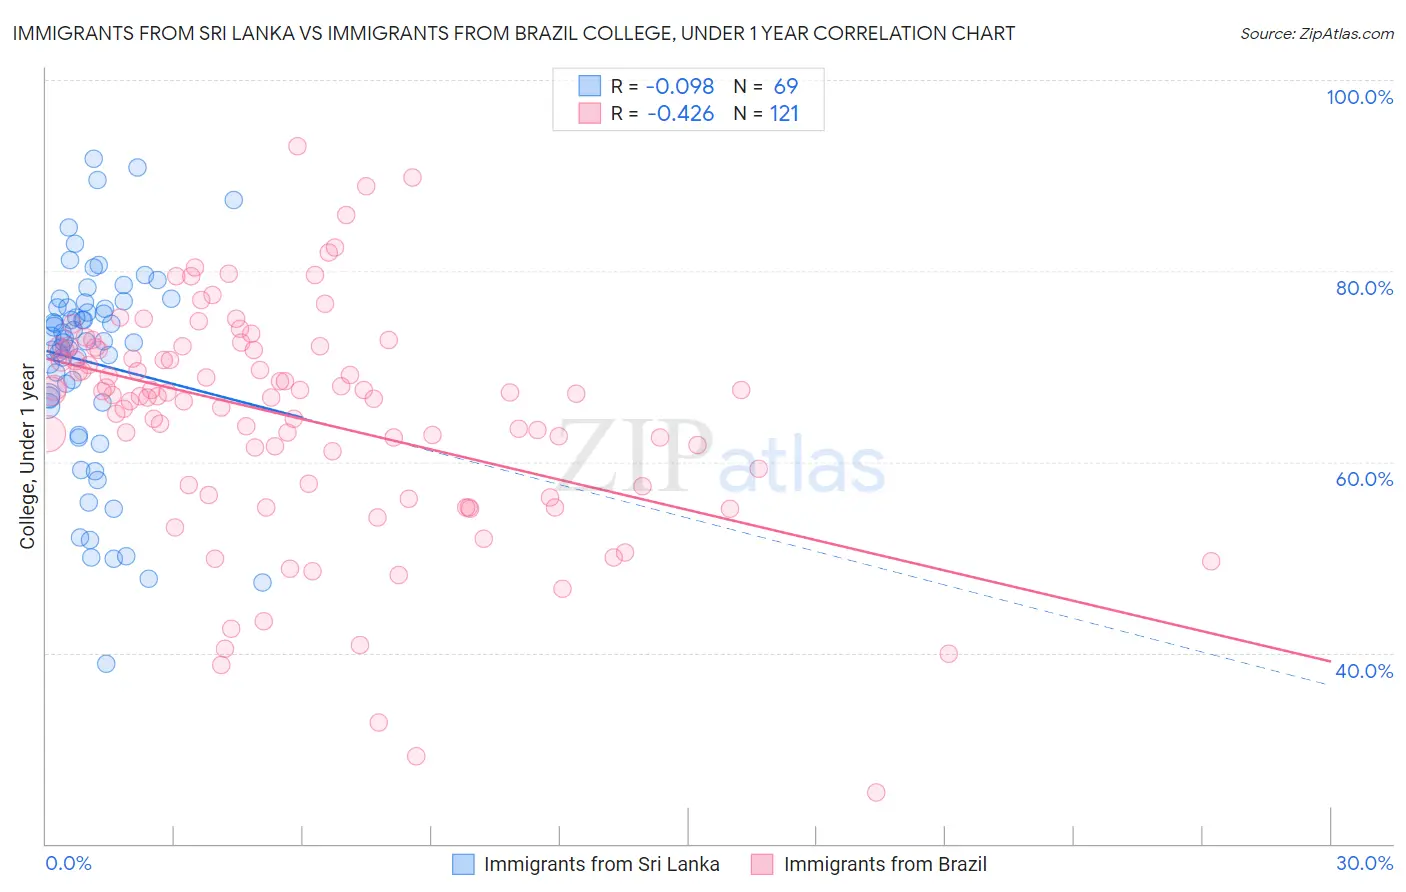
Immigrants from Sri Lanka vs Immigrants from Brazil College, Under 1 year Correlation Chart
The statistical analysis conducted on geographies consisting of 149,700,552 people shows a slight negative correlation between the proportion of Immigrants from Sri Lanka and percentage of population with at least college, under 1 year education in the United States with a correlation coefficient (R) of -0.098 and weighted average of 70.5%. Similarly, the statistical analysis conducted on geographies consisting of 343,021,697 people shows a moderate negative correlation between the proportion of Immigrants from Brazil and percentage of population with at least college, under 1 year education in the United States with a correlation coefficient (R) of -0.426 and weighted average of 66.9%, a difference of 5.4%.
College, Under 1 year Correlation Summary
| Measurement | Immigrants from Sri Lanka | Immigrants from Brazil |
| Minimum | 38.9% | 25.4% |
| Maximum | 91.7% | 93.0% |
| Range | 52.8% | 67.7% |
| Mean | 70.4% | 64.6% |
| Median | 72.6% | 67.0% |
| Interquartile 25% (IQ1) | 66.0% | 57.5% |
| Interquartile 75% (IQ3) | 76.4% | 71.9% |
| Interquartile Range (IQR) | 10.4% | 14.4% |
| Standard Deviation (Sample) | 10.9% | 12.0% |
| Standard Deviation (Population) | 10.8% | 11.9% |
Similar Demographics by College, Under 1 year
Demographics Similar to Immigrants from Sri Lanka by College, Under 1 year
In terms of college, under 1 year, the demographic groups most similar to Immigrants from Sri Lanka are Russian (70.5%, a difference of 0.060%), Immigrants from Saudi Arabia (70.4%, a difference of 0.11%), Estonian (70.6%, a difference of 0.15%), Immigrants from South Africa (70.6%, a difference of 0.16%), and Australian (70.4%, a difference of 0.18%).
| Demographics | Rating | Rank | College, Under 1 year |
| Immigrants | France | 100.0 /100 | #29 | Exceptional 71.0% |
| Immigrants | China | 99.9 /100 | #30 | Exceptional 70.9% |
| Indians (Asian) | 99.9 /100 | #31 | Exceptional 70.8% |
| Turks | 99.9 /100 | #32 | Exceptional 70.7% |
| Immigrants | South Africa | 99.9 /100 | #33 | Exceptional 70.6% |
| Estonians | 99.9 /100 | #34 | Exceptional 70.6% |
| Russians | 99.9 /100 | #35 | Exceptional 70.5% |
| Immigrants | Sri Lanka | 99.9 /100 | #36 | Exceptional 70.5% |
| Immigrants | Saudi Arabia | 99.9 /100 | #37 | Exceptional 70.4% |
| Australians | 99.9 /100 | #38 | Exceptional 70.4% |
| Bhutanese | 99.9 /100 | #39 | Exceptional 70.3% |
| Immigrants | Turkey | 99.9 /100 | #40 | Exceptional 70.3% |
| Immigrants | Kuwait | 99.9 /100 | #41 | Exceptional 70.3% |
| Immigrants | Lithuania | 99.9 /100 | #42 | Exceptional 70.3% |
| Israelis | 99.9 /100 | #43 | Exceptional 70.2% |
Demographics Similar to Immigrants from Brazil by College, Under 1 year
In terms of college, under 1 year, the demographic groups most similar to Immigrants from Brazil are Polish (66.9%, a difference of 0.010%), Finnish (66.9%, a difference of 0.030%), Iraqi (66.8%, a difference of 0.030%), Canadian (66.8%, a difference of 0.040%), and Ugandan (66.8%, a difference of 0.050%).
| Demographics | Rating | Rank | College, Under 1 year |
| Alsatians | 91.3 /100 | #126 | Exceptional 67.1% |
| Czechs | 90.8 /100 | #127 | Exceptional 67.1% |
| Scottish | 90.2 /100 | #128 | Exceptional 67.0% |
| Immigrants | Eastern Africa | 89.5 /100 | #129 | Excellent 67.0% |
| Immigrants | Syria | 89.0 /100 | #130 | Excellent 66.9% |
| Finns | 88.6 /100 | #131 | Excellent 66.9% |
| Poles | 88.4 /100 | #132 | Excellent 66.9% |
| Immigrants | Brazil | 88.3 /100 | #133 | Excellent 66.9% |
| Iraqis | 88.0 /100 | #134 | Excellent 66.8% |
| Canadians | 87.9 /100 | #135 | Excellent 66.8% |
| Ugandans | 87.8 /100 | #136 | Excellent 66.8% |
| Immigrants | Chile | 87.4 /100 | #137 | Excellent 66.8% |
| Immigrants | Italy | 86.9 /100 | #138 | Excellent 66.8% |
| Venezuelans | 85.9 /100 | #139 | Excellent 66.7% |
| Slavs | 85.9 /100 | #140 | Excellent 66.7% |