Immigrants from Sri Lanka vs Immigrants from West Indies College, Under 1 year
COMPARE
Immigrants from Sri Lanka
Immigrants from West Indies
College, Under 1 year
College, Under 1 year Comparison
Immigrants from Sri Lanka
Immigrants from West Indies
70.5%
COLLEGE, UNDER 1 YEAR
99.9/ 100
METRIC RATING
36th/ 347
METRIC RANK
60.6%
COLLEGE, UNDER 1 YEAR
0.1/ 100
METRIC RATING
269th/ 347
METRIC RANK
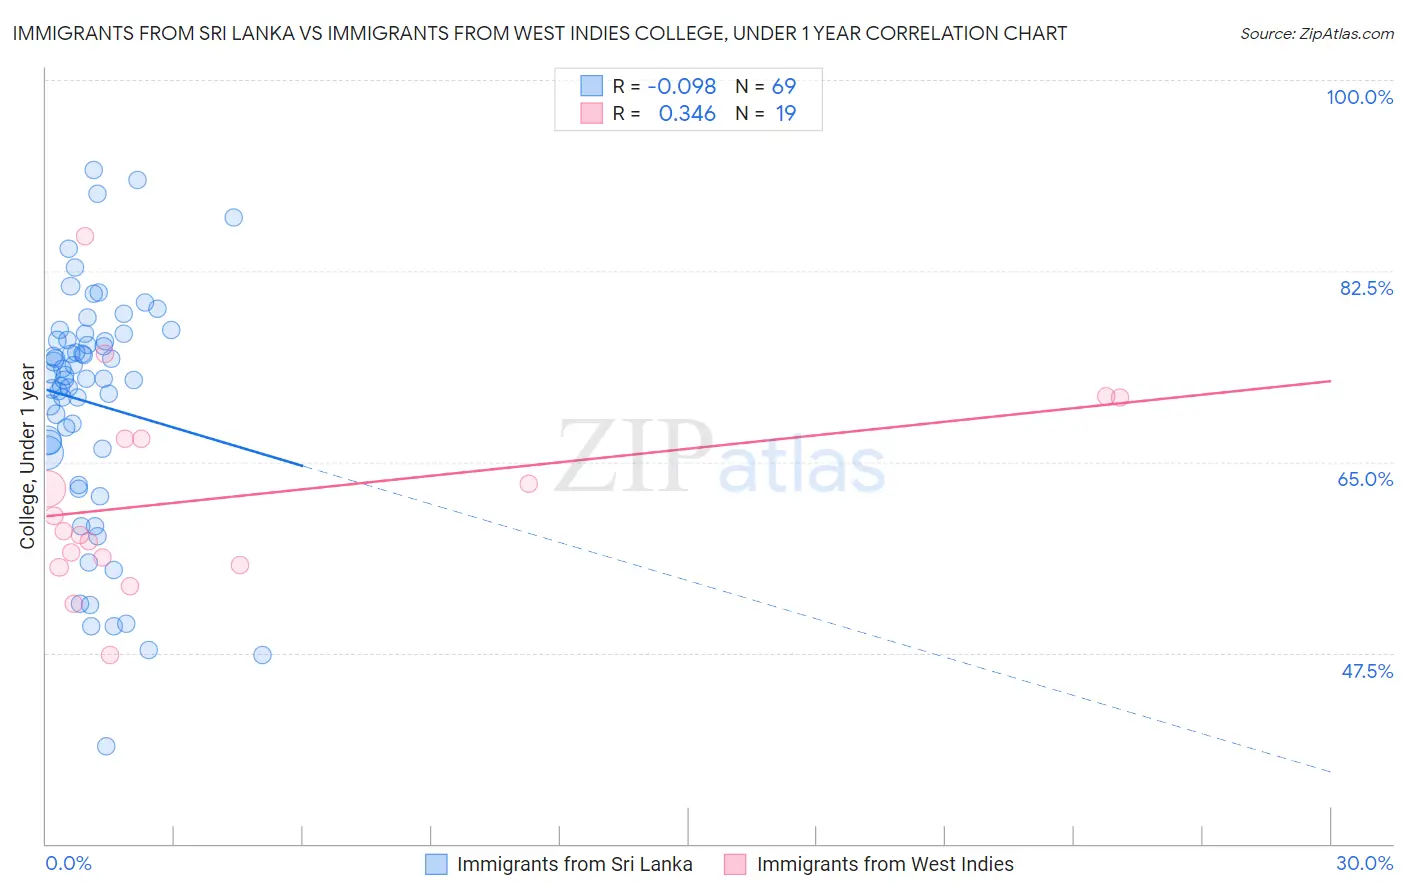
Immigrants from Sri Lanka vs Immigrants from West Indies College, Under 1 year Correlation Chart
The statistical analysis conducted on geographies consisting of 149,700,552 people shows a slight negative correlation between the proportion of Immigrants from Sri Lanka and percentage of population with at least college, under 1 year education in the United States with a correlation coefficient (R) of -0.098 and weighted average of 70.5%. Similarly, the statistical analysis conducted on geographies consisting of 72,457,514 people shows a mild positive correlation between the proportion of Immigrants from West Indies and percentage of population with at least college, under 1 year education in the United States with a correlation coefficient (R) of 0.346 and weighted average of 60.6%, a difference of 16.2%.
College, Under 1 year Correlation Summary
| Measurement | Immigrants from Sri Lanka | Immigrants from West Indies |
| Minimum | 38.9% | 47.3% |
| Maximum | 91.7% | 85.6% |
| Range | 52.8% | 38.3% |
| Mean | 70.4% | 61.8% |
| Median | 72.6% | 58.6% |
| Interquartile 25% (IQ1) | 66.0% | 55.5% |
| Interquartile 75% (IQ3) | 76.4% | 67.2% |
| Interquartile Range (IQR) | 10.4% | 11.6% |
| Standard Deviation (Sample) | 10.9% | 9.2% |
| Standard Deviation (Population) | 10.8% | 8.9% |
Similar Demographics by College, Under 1 year
Demographics Similar to Immigrants from Sri Lanka by College, Under 1 year
In terms of college, under 1 year, the demographic groups most similar to Immigrants from Sri Lanka are Russian (70.5%, a difference of 0.060%), Immigrants from Saudi Arabia (70.4%, a difference of 0.11%), Estonian (70.6%, a difference of 0.15%), Immigrants from South Africa (70.6%, a difference of 0.16%), and Australian (70.4%, a difference of 0.18%).
| Demographics | Rating | Rank | College, Under 1 year |
| Immigrants | France | 100.0 /100 | #29 | Exceptional 71.0% |
| Immigrants | China | 99.9 /100 | #30 | Exceptional 70.9% |
| Indians (Asian) | 99.9 /100 | #31 | Exceptional 70.8% |
| Turks | 99.9 /100 | #32 | Exceptional 70.7% |
| Immigrants | South Africa | 99.9 /100 | #33 | Exceptional 70.6% |
| Estonians | 99.9 /100 | #34 | Exceptional 70.6% |
| Russians | 99.9 /100 | #35 | Exceptional 70.5% |
| Immigrants | Sri Lanka | 99.9 /100 | #36 | Exceptional 70.5% |
| Immigrants | Saudi Arabia | 99.9 /100 | #37 | Exceptional 70.4% |
| Australians | 99.9 /100 | #38 | Exceptional 70.4% |
| Bhutanese | 99.9 /100 | #39 | Exceptional 70.3% |
| Immigrants | Turkey | 99.9 /100 | #40 | Exceptional 70.3% |
| Immigrants | Kuwait | 99.9 /100 | #41 | Exceptional 70.3% |
| Immigrants | Lithuania | 99.9 /100 | #42 | Exceptional 70.3% |
| Israelis | 99.9 /100 | #43 | Exceptional 70.2% |
Demographics Similar to Immigrants from West Indies by College, Under 1 year
In terms of college, under 1 year, the demographic groups most similar to Immigrants from West Indies are Cheyenne (60.6%, a difference of 0.11%), Immigrants from Trinidad and Tobago (60.7%, a difference of 0.12%), U.S. Virgin Islander (60.6%, a difference of 0.13%), Jamaican (60.5%, a difference of 0.28%), and Chickasaw (60.4%, a difference of 0.33%).
| Demographics | Rating | Rank | College, Under 1 year |
| Barbadians | 0.2 /100 | #262 | Tragic 61.1% |
| Shoshone | 0.2 /100 | #263 | Tragic 61.1% |
| Trinidadians and Tobagonians | 0.2 /100 | #264 | Tragic 61.1% |
| Immigrants | Bahamas | 0.2 /100 | #265 | Tragic 61.1% |
| Alaskan Athabascans | 0.2 /100 | #266 | Tragic 61.0% |
| Americans | 0.2 /100 | #267 | Tragic 61.0% |
| Immigrants | Trinidad and Tobago | 0.1 /100 | #268 | Tragic 60.7% |
| Immigrants | West Indies | 0.1 /100 | #269 | Tragic 60.6% |
| Cheyenne | 0.1 /100 | #270 | Tragic 60.6% |
| U.S. Virgin Islanders | 0.1 /100 | #271 | Tragic 60.6% |
| Jamaicans | 0.1 /100 | #272 | Tragic 60.5% |
| Chickasaw | 0.1 /100 | #273 | Tragic 60.4% |
| Alaska Natives | 0.1 /100 | #274 | Tragic 60.4% |
| Immigrants | Barbados | 0.1 /100 | #275 | Tragic 60.4% |
| Arapaho | 0.1 /100 | #276 | Tragic 60.3% |