Immigrants from Sri Lanka vs Immigrants from St. Vincent and the Grenadines College, Under 1 year
COMPARE
Immigrants from Sri Lanka
Immigrants from St. Vincent and the Grenadines
College, Under 1 year
College, Under 1 year Comparison
Immigrants from Sri Lanka
Immigrants from St. Vincent and the Grenadines
70.5%
COLLEGE, UNDER 1 YEAR
99.9/ 100
METRIC RATING
36th/ 347
METRIC RANK
59.6%
COLLEGE, UNDER 1 YEAR
0.0/ 100
METRIC RATING
284th/ 347
METRIC RANK
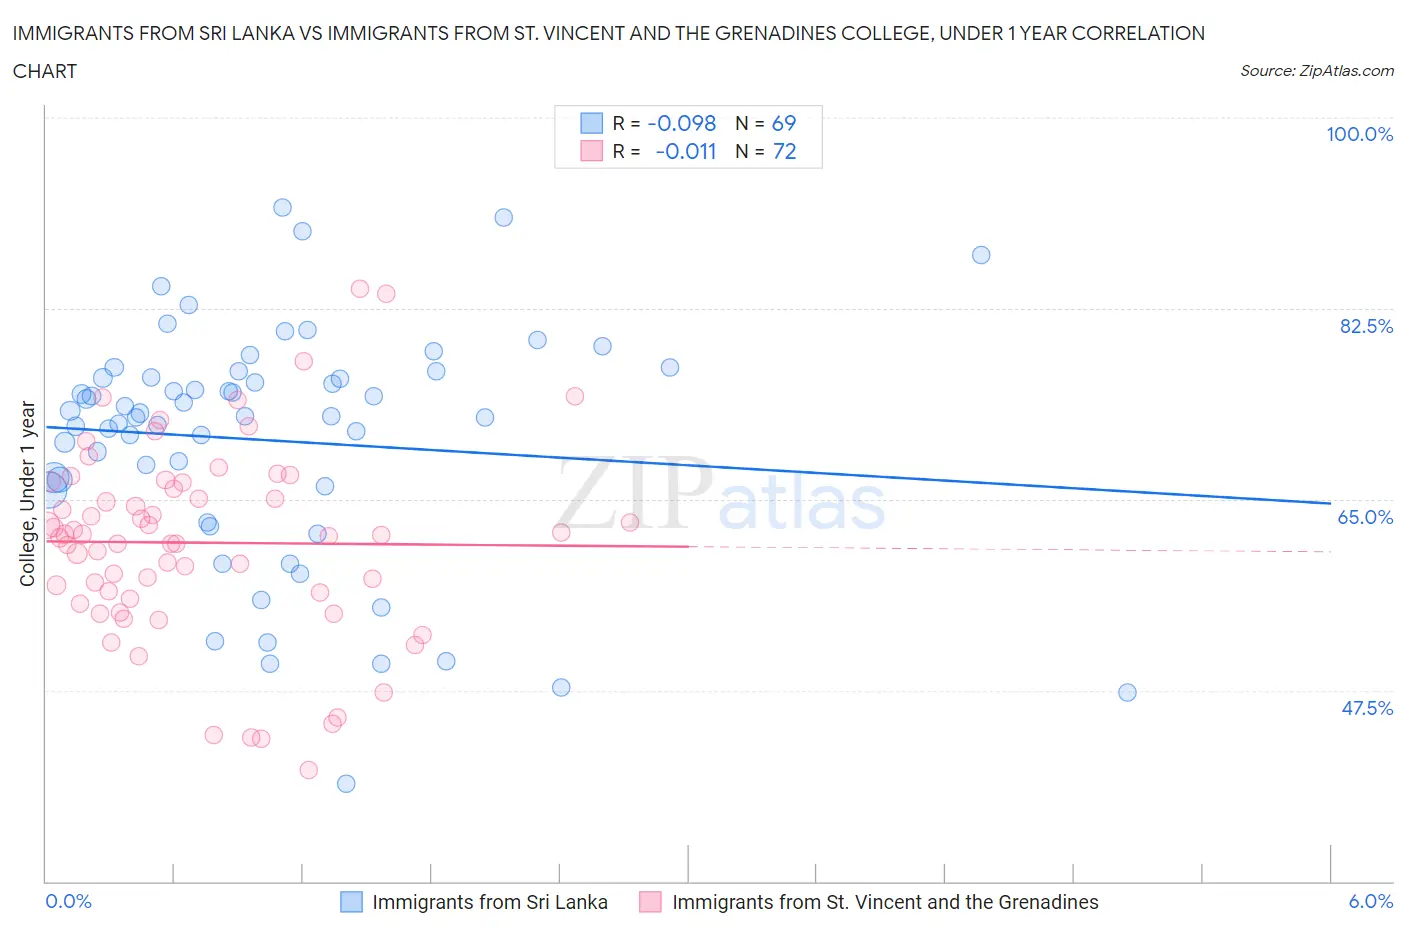
Immigrants from Sri Lanka vs Immigrants from St. Vincent and the Grenadines College, Under 1 year Correlation Chart
The statistical analysis conducted on geographies consisting of 149,700,552 people shows a slight negative correlation between the proportion of Immigrants from Sri Lanka and percentage of population with at least college, under 1 year education in the United States with a correlation coefficient (R) of -0.098 and weighted average of 70.5%. Similarly, the statistical analysis conducted on geographies consisting of 56,185,220 people shows no correlation between the proportion of Immigrants from St. Vincent and the Grenadines and percentage of population with at least college, under 1 year education in the United States with a correlation coefficient (R) of -0.011 and weighted average of 59.6%, a difference of 18.2%.
College, Under 1 year Correlation Summary
| Measurement | Immigrants from Sri Lanka | Immigrants from St. Vincent and the Grenadines |
| Minimum | 38.9% | 40.2% |
| Maximum | 91.7% | 84.3% |
| Range | 52.8% | 44.1% |
| Mean | 70.4% | 61.0% |
| Median | 72.6% | 61.7% |
| Interquartile 25% (IQ1) | 66.0% | 56.1% |
| Interquartile 75% (IQ3) | 76.4% | 66.3% |
| Interquartile Range (IQR) | 10.4% | 10.1% |
| Standard Deviation (Sample) | 10.9% | 8.9% |
| Standard Deviation (Population) | 10.8% | 8.8% |
Similar Demographics by College, Under 1 year
Demographics Similar to Immigrants from Sri Lanka by College, Under 1 year
In terms of college, under 1 year, the demographic groups most similar to Immigrants from Sri Lanka are Russian (70.5%, a difference of 0.060%), Immigrants from Saudi Arabia (70.4%, a difference of 0.11%), Estonian (70.6%, a difference of 0.15%), Immigrants from South Africa (70.6%, a difference of 0.16%), and Australian (70.4%, a difference of 0.18%).
| Demographics | Rating | Rank | College, Under 1 year |
| Immigrants | France | 100.0 /100 | #29 | Exceptional 71.0% |
| Immigrants | China | 99.9 /100 | #30 | Exceptional 70.9% |
| Indians (Asian) | 99.9 /100 | #31 | Exceptional 70.8% |
| Turks | 99.9 /100 | #32 | Exceptional 70.7% |
| Immigrants | South Africa | 99.9 /100 | #33 | Exceptional 70.6% |
| Estonians | 99.9 /100 | #34 | Exceptional 70.6% |
| Russians | 99.9 /100 | #35 | Exceptional 70.5% |
| Immigrants | Sri Lanka | 99.9 /100 | #36 | Exceptional 70.5% |
| Immigrants | Saudi Arabia | 99.9 /100 | #37 | Exceptional 70.4% |
| Australians | 99.9 /100 | #38 | Exceptional 70.4% |
| Bhutanese | 99.9 /100 | #39 | Exceptional 70.3% |
| Immigrants | Turkey | 99.9 /100 | #40 | Exceptional 70.3% |
| Immigrants | Kuwait | 99.9 /100 | #41 | Exceptional 70.3% |
| Immigrants | Lithuania | 99.9 /100 | #42 | Exceptional 70.3% |
| Israelis | 99.9 /100 | #43 | Exceptional 70.2% |
Demographics Similar to Immigrants from St. Vincent and the Grenadines by College, Under 1 year
In terms of college, under 1 year, the demographic groups most similar to Immigrants from St. Vincent and the Grenadines are Paiute (59.6%, a difference of 0.010%), Immigrants from Jamaica (59.7%, a difference of 0.11%), British West Indian (59.5%, a difference of 0.15%), Sioux (59.4%, a difference of 0.32%), and Black/African American (59.4%, a difference of 0.42%).
| Demographics | Rating | Rank | College, Under 1 year |
| Bahamians | 0.1 /100 | #277 | Tragic 60.3% |
| Yaqui | 0.1 /100 | #278 | Tragic 60.2% |
| Ute | 0.1 /100 | #279 | Tragic 60.2% |
| Crow | 0.1 /100 | #280 | Tragic 60.2% |
| Cherokee | 0.1 /100 | #281 | Tragic 60.1% |
| Belizeans | 0.1 /100 | #282 | Tragic 60.1% |
| Immigrants | Jamaica | 0.0 /100 | #283 | Tragic 59.7% |
| Immigrants | St. Vincent and the Grenadines | 0.0 /100 | #284 | Tragic 59.6% |
| Paiute | 0.0 /100 | #285 | Tragic 59.6% |
| British West Indians | 0.0 /100 | #286 | Tragic 59.5% |
| Sioux | 0.0 /100 | #287 | Tragic 59.4% |
| Blacks/African Americans | 0.0 /100 | #288 | Tragic 59.4% |
| Choctaw | 0.0 /100 | #289 | Tragic 59.3% |
| Ecuadorians | 0.0 /100 | #290 | Tragic 59.3% |
| Creek | 0.0 /100 | #291 | Tragic 59.3% |