Immigrants from Vietnam vs Immigrants from Cambodia GED/Equivalency
COMPARE
Immigrants from Vietnam
Immigrants from Cambodia
GED/Equivalency
GED/Equivalency Comparison
Immigrants from Vietnam
Immigrants from Cambodia
83.2%
GED/EQUIVALENCY
0.3/ 100
METRIC RATING
259th/ 347
METRIC RANK
82.2%
GED/EQUIVALENCY
0.0/ 100
METRIC RATING
289th/ 347
METRIC RANK
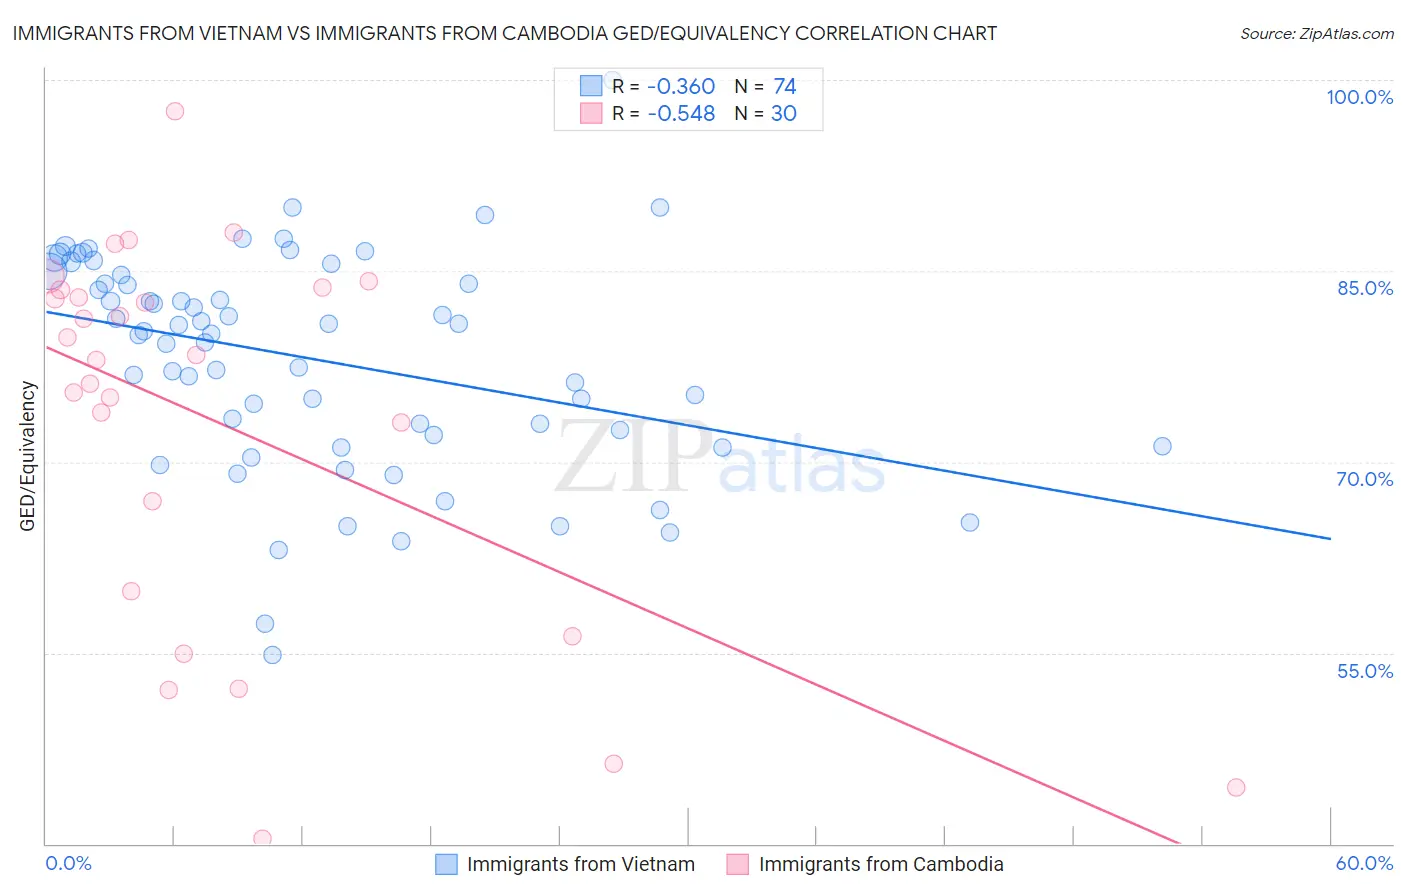
Immigrants from Vietnam vs Immigrants from Cambodia GED/Equivalency Correlation Chart
The statistical analysis conducted on geographies consisting of 404,843,872 people shows a mild negative correlation between the proportion of Immigrants from Vietnam and percentage of population with at least ged/equivalency education in the United States with a correlation coefficient (R) of -0.360 and weighted average of 83.2%. Similarly, the statistical analysis conducted on geographies consisting of 205,153,442 people shows a substantial negative correlation between the proportion of Immigrants from Cambodia and percentage of population with at least ged/equivalency education in the United States with a correlation coefficient (R) of -0.548 and weighted average of 82.2%, a difference of 1.1%.
GED/Equivalency Correlation Summary
| Measurement | Immigrants from Vietnam | Immigrants from Cambodia |
| Minimum | 54.8% | 40.4% |
| Maximum | 100.0% | 97.5% |
| Range | 45.2% | 57.1% |
| Mean | 78.1% | 73.0% |
| Median | 80.2% | 78.2% |
| Interquartile 25% (IQ1) | 72.1% | 59.8% |
| Interquartile 75% (IQ3) | 84.7% | 83.5% |
| Interquartile Range (IQR) | 12.6% | 23.7% |
| Standard Deviation (Sample) | 8.5% | 15.0% |
| Standard Deviation (Population) | 8.5% | 14.8% |
Similar Demographics by GED/Equivalency
Demographics Similar to Immigrants from Vietnam by GED/Equivalency
In terms of ged/equivalency, the demographic groups most similar to Immigrants from Vietnam are Choctaw (83.1%, a difference of 0.030%), Inupiat (83.1%, a difference of 0.090%), Immigrants from Armenia (83.1%, a difference of 0.090%), Immigrants from Congo (83.1%, a difference of 0.10%), and Bangladeshi (83.1%, a difference of 0.11%).
| Demographics | Rating | Rank | GED/Equivalency |
| Bahamians | 0.8 /100 | #252 | Tragic 83.6% |
| Comanche | 0.7 /100 | #253 | Tragic 83.6% |
| Creek | 0.7 /100 | #254 | Tragic 83.6% |
| Colville | 0.5 /100 | #255 | Tragic 83.4% |
| Africans | 0.5 /100 | #256 | Tragic 83.4% |
| Jamaicans | 0.4 /100 | #257 | Tragic 83.3% |
| Malaysians | 0.4 /100 | #258 | Tragic 83.3% |
| Immigrants | Vietnam | 0.3 /100 | #259 | Tragic 83.2% |
| Choctaw | 0.3 /100 | #260 | Tragic 83.1% |
| Inupiat | 0.2 /100 | #261 | Tragic 83.1% |
| Immigrants | Armenia | 0.2 /100 | #262 | Tragic 83.1% |
| Immigrants | Congo | 0.2 /100 | #263 | Tragic 83.1% |
| Bangladeshis | 0.2 /100 | #264 | Tragic 83.1% |
| West Indians | 0.2 /100 | #265 | Tragic 83.1% |
| Kiowa | 0.2 /100 | #266 | Tragic 83.1% |
Demographics Similar to Immigrants from Cambodia by GED/Equivalency
In terms of ged/equivalency, the demographic groups most similar to Immigrants from Cambodia are Pueblo (82.3%, a difference of 0.080%), Japanese (82.4%, a difference of 0.18%), Immigrants from West Indies (82.4%, a difference of 0.19%), Haitian (82.1%, a difference of 0.19%), and Cajun (82.4%, a difference of 0.22%).
| Demographics | Rating | Rank | GED/Equivalency |
| Immigrants | Immigrants | 0.1 /100 | #282 | Tragic 82.6% |
| Indonesians | 0.1 /100 | #283 | Tragic 82.5% |
| Immigrants | Barbados | 0.1 /100 | #284 | Tragic 82.4% |
| Cajuns | 0.0 /100 | #285 | Tragic 82.4% |
| Immigrants | West Indies | 0.0 /100 | #286 | Tragic 82.4% |
| Japanese | 0.0 /100 | #287 | Tragic 82.4% |
| Pueblo | 0.0 /100 | #288 | Tragic 82.3% |
| Immigrants | Cambodia | 0.0 /100 | #289 | Tragic 82.2% |
| Haitians | 0.0 /100 | #290 | Tragic 82.1% |
| Cubans | 0.0 /100 | #291 | Tragic 82.0% |
| Paiute | 0.0 /100 | #292 | Tragic 82.0% |
| British West Indians | 0.0 /100 | #293 | Tragic 82.0% |
| Immigrants | St. Vincent and the Grenadines | 0.0 /100 | #294 | Tragic 82.0% |
| Nepalese | 0.0 /100 | #295 | Tragic 81.9% |
| Vietnamese | 0.0 /100 | #296 | Tragic 81.9% |