Immigrants from Eastern Europe vs Immigrants from Cambodia GED/Equivalency
COMPARE
Immigrants from Eastern Europe
Immigrants from Cambodia
GED/Equivalency
GED/Equivalency Comparison
Immigrants from Eastern Europe
Immigrants from Cambodia
87.1%
GED/EQUIVALENCY
95.5/ 100
METRIC RATING
109th/ 347
METRIC RANK
82.2%
GED/EQUIVALENCY
0.0/ 100
METRIC RATING
289th/ 347
METRIC RANK
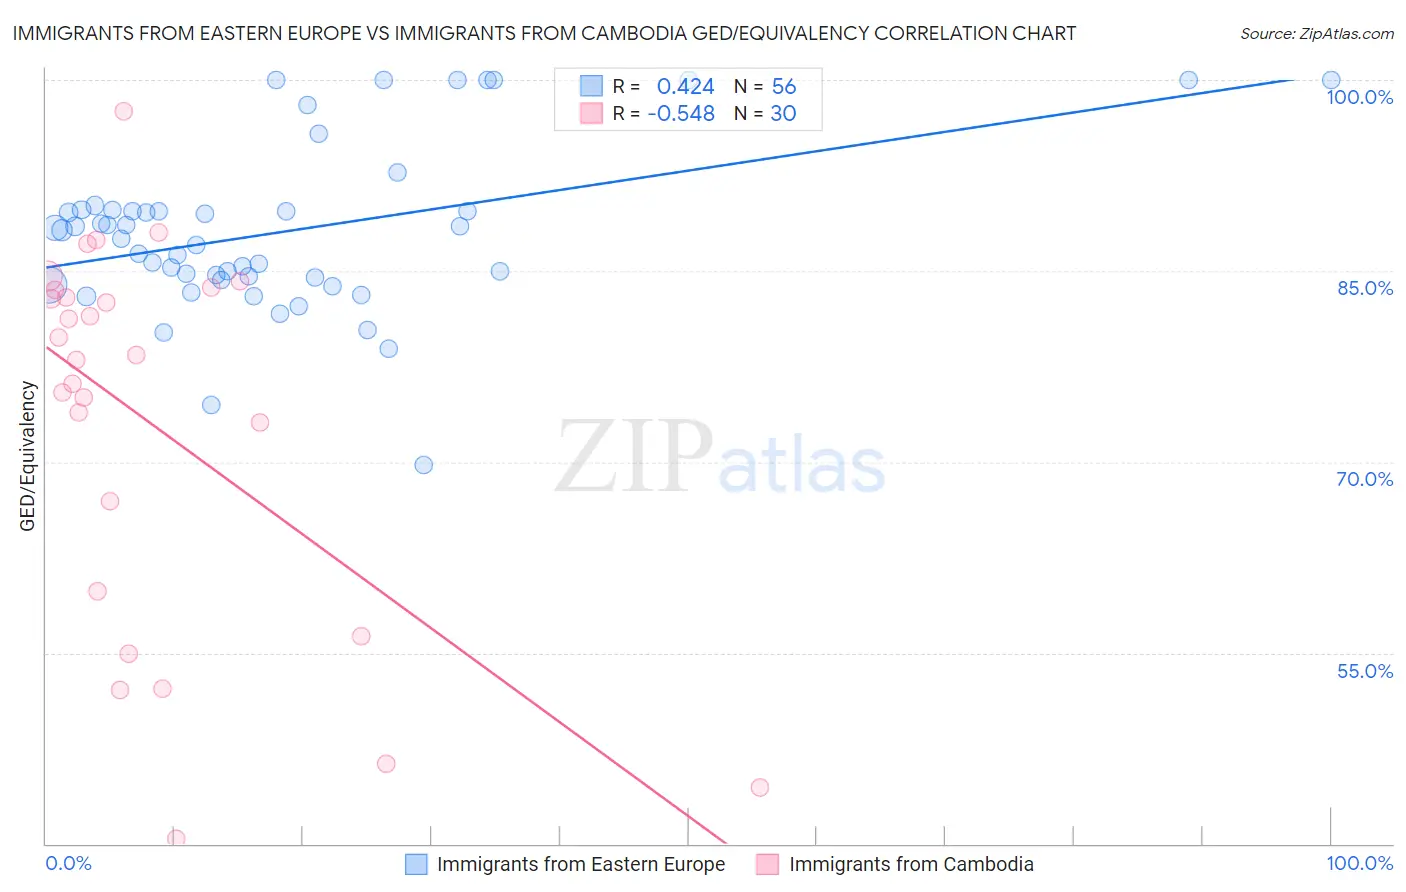
Immigrants from Eastern Europe vs Immigrants from Cambodia GED/Equivalency Correlation Chart
The statistical analysis conducted on geographies consisting of 475,879,420 people shows a moderate positive correlation between the proportion of Immigrants from Eastern Europe and percentage of population with at least ged/equivalency education in the United States with a correlation coefficient (R) of 0.424 and weighted average of 87.1%. Similarly, the statistical analysis conducted on geographies consisting of 205,153,442 people shows a substantial negative correlation between the proportion of Immigrants from Cambodia and percentage of population with at least ged/equivalency education in the United States with a correlation coefficient (R) of -0.548 and weighted average of 82.2%, a difference of 5.9%.
GED/Equivalency Correlation Summary
| Measurement | Immigrants from Eastern Europe | Immigrants from Cambodia |
| Minimum | 69.7% | 40.4% |
| Maximum | 100.0% | 97.5% |
| Range | 30.3% | 57.1% |
| Mean | 88.1% | 73.0% |
| Median | 87.9% | 78.2% |
| Interquartile 25% (IQ1) | 84.4% | 59.8% |
| Interquartile 75% (IQ3) | 89.7% | 83.5% |
| Interquartile Range (IQR) | 5.4% | 23.7% |
| Standard Deviation (Sample) | 6.6% | 15.0% |
| Standard Deviation (Population) | 6.5% | 14.8% |
Similar Demographics by GED/Equivalency
Demographics Similar to Immigrants from Eastern Europe by GED/Equivalency
In terms of ged/equivalency, the demographic groups most similar to Immigrants from Eastern Europe are Canadian (87.1%, a difference of 0.010%), Icelander (87.1%, a difference of 0.030%), Egyptian (87.1%, a difference of 0.030%), French (87.1%, a difference of 0.030%), and Immigrants from Zimbabwe (87.1%, a difference of 0.040%).
| Demographics | Rating | Rank | GED/Equivalency |
| Lebanese | 96.2 /100 | #102 | Exceptional 87.2% |
| Jordanians | 96.1 /100 | #103 | Exceptional 87.2% |
| Immigrants | Hungary | 96.0 /100 | #104 | Exceptional 87.2% |
| Indians (Asian) | 95.9 /100 | #105 | Exceptional 87.1% |
| Immigrants | Zimbabwe | 95.8 /100 | #106 | Exceptional 87.1% |
| Icelanders | 95.7 /100 | #107 | Exceptional 87.1% |
| Canadians | 95.6 /100 | #108 | Exceptional 87.1% |
| Immigrants | Eastern Europe | 95.5 /100 | #109 | Exceptional 87.1% |
| Egyptians | 95.3 /100 | #110 | Exceptional 87.1% |
| French | 95.2 /100 | #111 | Exceptional 87.1% |
| Tlingit-Haida | 94.8 /100 | #112 | Exceptional 87.0% |
| Assyrians/Chaldeans/Syriacs | 94.8 /100 | #113 | Exceptional 87.0% |
| Immigrants | Kazakhstan | 94.7 /100 | #114 | Exceptional 87.0% |
| Mongolians | 94.6 /100 | #115 | Exceptional 87.0% |
| Swiss | 94.5 /100 | #116 | Exceptional 87.0% |
Demographics Similar to Immigrants from Cambodia by GED/Equivalency
In terms of ged/equivalency, the demographic groups most similar to Immigrants from Cambodia are Pueblo (82.3%, a difference of 0.080%), Japanese (82.4%, a difference of 0.18%), Immigrants from West Indies (82.4%, a difference of 0.19%), Haitian (82.1%, a difference of 0.19%), and Cajun (82.4%, a difference of 0.22%).
| Demographics | Rating | Rank | GED/Equivalency |
| Immigrants | Immigrants | 0.1 /100 | #282 | Tragic 82.6% |
| Indonesians | 0.1 /100 | #283 | Tragic 82.5% |
| Immigrants | Barbados | 0.1 /100 | #284 | Tragic 82.4% |
| Cajuns | 0.0 /100 | #285 | Tragic 82.4% |
| Immigrants | West Indies | 0.0 /100 | #286 | Tragic 82.4% |
| Japanese | 0.0 /100 | #287 | Tragic 82.4% |
| Pueblo | 0.0 /100 | #288 | Tragic 82.3% |
| Immigrants | Cambodia | 0.0 /100 | #289 | Tragic 82.2% |
| Haitians | 0.0 /100 | #290 | Tragic 82.1% |
| Cubans | 0.0 /100 | #291 | Tragic 82.0% |
| Paiute | 0.0 /100 | #292 | Tragic 82.0% |
| British West Indians | 0.0 /100 | #293 | Tragic 82.0% |
| Immigrants | St. Vincent and the Grenadines | 0.0 /100 | #294 | Tragic 82.0% |
| Nepalese | 0.0 /100 | #295 | Tragic 81.9% |
| Vietnamese | 0.0 /100 | #296 | Tragic 81.9% |