Immigrants from Spain vs Immigrants from Cambodia Householder Income Ages 25 - 44 years
COMPARE
Immigrants from Spain
Immigrants from Cambodia
Householder Income Ages 25 - 44 years
Householder Income Ages 25 - 44 years Comparison
Immigrants from Spain
Immigrants from Cambodia
$103,752
HOUSEHOLDER INCOME AGES 25 - 44 YEARS
99.4/ 100
METRIC RATING
76th/ 347
METRIC RANK
$91,533
HOUSEHOLDER INCOME AGES 25 - 44 YEARS
15.7/ 100
METRIC RATING
203rd/ 347
METRIC RANK
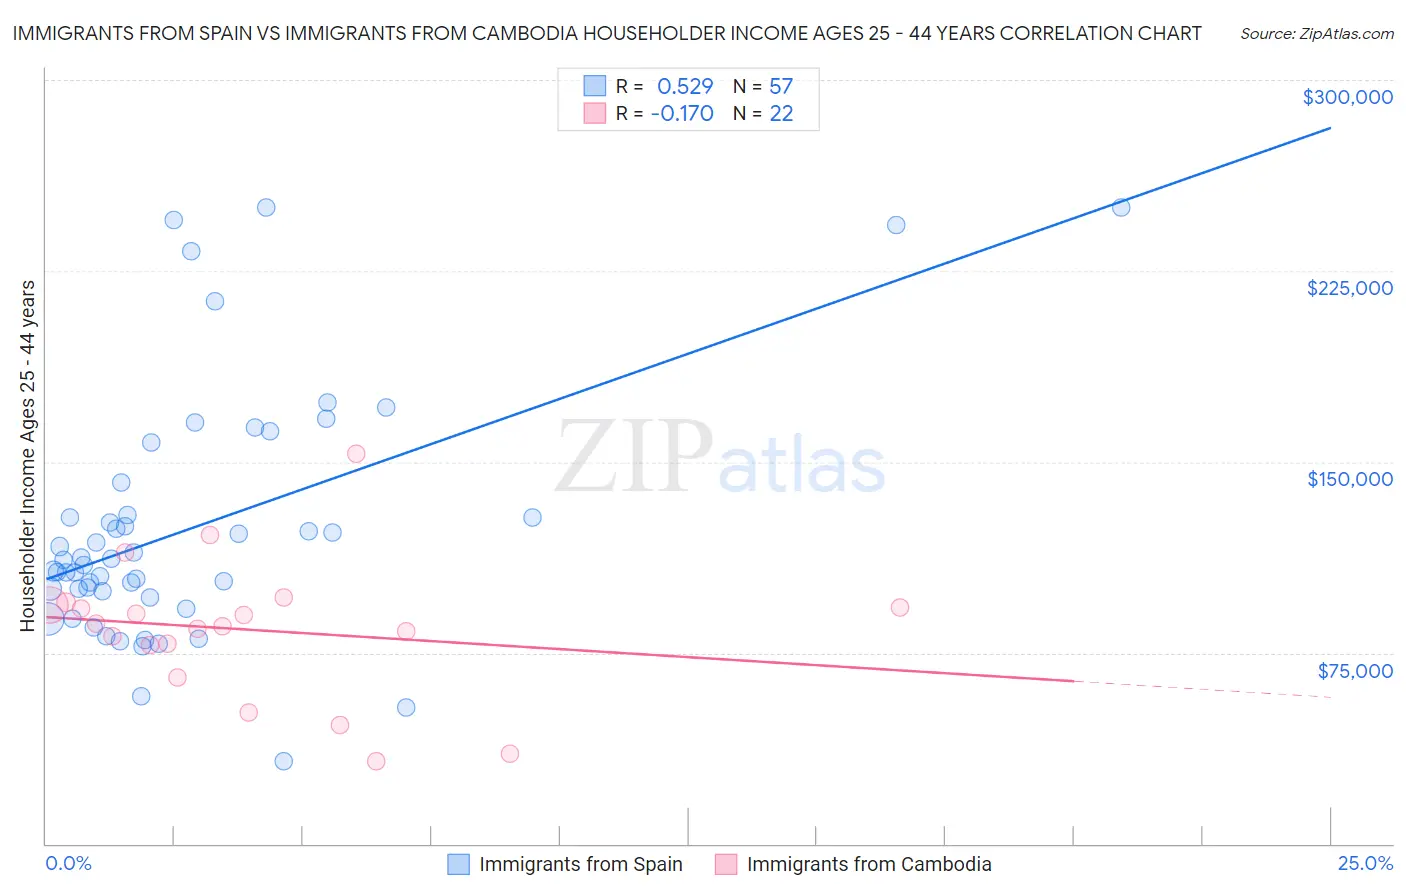
Immigrants from Spain vs Immigrants from Cambodia Householder Income Ages 25 - 44 years Correlation Chart
The statistical analysis conducted on geographies consisting of 239,393,463 people shows a substantial positive correlation between the proportion of Immigrants from Spain and household income with householder between the ages 25 and 44 in the United States with a correlation coefficient (R) of 0.529 and weighted average of $103,752. Similarly, the statistical analysis conducted on geographies consisting of 205,045,995 people shows a poor negative correlation between the proportion of Immigrants from Cambodia and household income with householder between the ages 25 and 44 in the United States with a correlation coefficient (R) of -0.170 and weighted average of $91,533, a difference of 13.4%.
Householder Income Ages 25 - 44 years Correlation Summary
| Measurement | Immigrants from Spain | Immigrants from Cambodia |
| Minimum | $32,176 | $32,434 |
| Maximum | $250,001 | $153,083 |
| Range | $217,825 | $120,649 |
| Mean | $124,125 | $84,078 |
| Median | $111,426 | $86,079 |
| Interquartile 25% (IQ1) | $97,925 | $78,256 |
| Interquartile 75% (IQ3) | $135,552 | $93,913 |
| Interquartile Range (IQR) | $37,627 | $15,657 |
| Standard Deviation (Sample) | $49,117 | $27,275 |
| Standard Deviation (Population) | $48,684 | $26,648 |
Similar Demographics by Householder Income Ages 25 - 44 years
Demographics Similar to Immigrants from Spain by Householder Income Ages 25 - 44 years
In terms of householder income ages 25 - 44 years, the demographic groups most similar to Immigrants from Spain are Korean ($103,824, a difference of 0.070%), Immigrants from Fiji ($103,954, a difference of 0.19%), Immigrants from Southern Europe ($103,486, a difference of 0.26%), Immigrants from Bulgaria ($103,423, a difference of 0.32%), and Italian ($104,215, a difference of 0.45%).
| Demographics | Rating | Rank | Householder Income Ages 25 - 44 years |
| Mongolians | 99.6 /100 | #69 | Exceptional $104,578 |
| Immigrants | Croatia | 99.6 /100 | #70 | Exceptional $104,503 |
| Afghans | 99.6 /100 | #71 | Exceptional $104,410 |
| Chinese | 99.5 /100 | #72 | Exceptional $104,264 |
| Italians | 99.5 /100 | #73 | Exceptional $104,215 |
| Immigrants | Fiji | 99.5 /100 | #74 | Exceptional $103,954 |
| Koreans | 99.4 /100 | #75 | Exceptional $103,824 |
| Immigrants | Spain | 99.4 /100 | #76 | Exceptional $103,752 |
| Immigrants | Southern Europe | 99.3 /100 | #77 | Exceptional $103,486 |
| Immigrants | Bulgaria | 99.3 /100 | #78 | Exceptional $103,423 |
| Armenians | 99.2 /100 | #79 | Exceptional $103,248 |
| Immigrants | Egypt | 99.2 /100 | #80 | Exceptional $103,192 |
| South Africans | 99.2 /100 | #81 | Exceptional $103,160 |
| Immigrants | Serbia | 99.2 /100 | #82 | Exceptional $103,155 |
| Argentineans | 99.1 /100 | #83 | Exceptional $103,111 |
Demographics Similar to Immigrants from Cambodia by Householder Income Ages 25 - 44 years
In terms of householder income ages 25 - 44 years, the demographic groups most similar to Immigrants from Cambodia are Ecuadorian ($91,574, a difference of 0.040%), Nepalese ($91,498, a difference of 0.040%), Immigrants from Eastern Africa ($91,458, a difference of 0.080%), Japanese ($91,624, a difference of 0.10%), and White/Caucasian ($91,668, a difference of 0.15%).
| Demographics | Rating | Rank | Householder Income Ages 25 - 44 years |
| Immigrants | Colombia | 21.3 /100 | #196 | Fair $92,204 |
| Spanish | 21.2 /100 | #197 | Fair $92,200 |
| Vietnamese | 20.2 /100 | #198 | Fair $92,089 |
| Kenyans | 16.8 /100 | #199 | Poor $91,684 |
| Whites/Caucasians | 16.7 /100 | #200 | Poor $91,668 |
| Japanese | 16.4 /100 | #201 | Poor $91,624 |
| Ecuadorians | 16.0 /100 | #202 | Poor $91,574 |
| Immigrants | Cambodia | 15.7 /100 | #203 | Poor $91,533 |
| Nepalese | 15.4 /100 | #204 | Poor $91,498 |
| Immigrants | Eastern Africa | 15.2 /100 | #205 | Poor $91,458 |
| Aleuts | 14.5 /100 | #206 | Poor $91,370 |
| Yugoslavians | 14.5 /100 | #207 | Poor $91,368 |
| Immigrants | Thailand | 14.3 /100 | #208 | Poor $91,337 |
| Immigrants | Uruguay | 13.2 /100 | #209 | Poor $91,171 |
| Immigrants | Kenya | 10.9 /100 | #210 | Poor $90,767 |