Immigrants from Spain vs Houma Median Family Income
COMPARE
Immigrants from Spain
Houma
Median Family Income
Median Family Income Comparison
Immigrants from Spain
Houma
$113,815
MEDIAN FAMILY INCOME
99.7/ 100
METRIC RATING
67th/ 347
METRIC RANK
$76,188
MEDIAN FAMILY INCOME
0.0/ 100
METRIC RATING
343rd/ 347
METRIC RANK
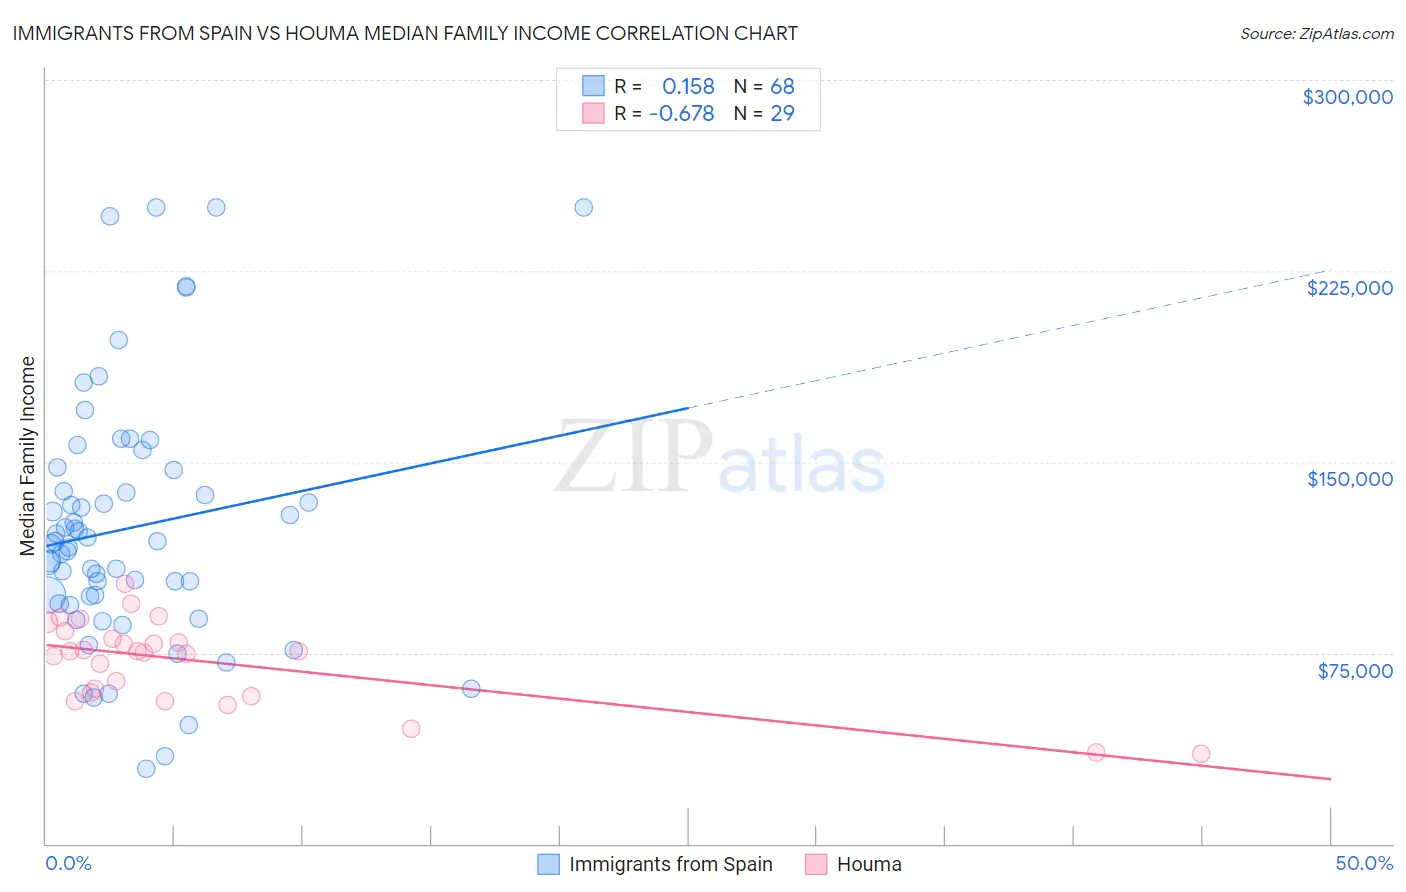
Immigrants from Spain vs Houma Median Family Income Correlation Chart
The statistical analysis conducted on geographies consisting of 239,551,632 people shows a poor positive correlation between the proportion of Immigrants from Spain and median family income in the United States with a correlation coefficient (R) of 0.158 and weighted average of $113,815. Similarly, the statistical analysis conducted on geographies consisting of 36,790,797 people shows a significant negative correlation between the proportion of Houma and median family income in the United States with a correlation coefficient (R) of -0.678 and weighted average of $76,188, a difference of 49.4%.
Median Family Income Correlation Summary
| Measurement | Immigrants from Spain | Houma |
| Minimum | $29,286 | $35,539 |
| Maximum | $250,001 | $102,344 |
| Range | $220,715 | $66,805 |
| Mean | $124,049 | $71,438 |
| Median | $118,215 | $75,379 |
| Interquartile 25% (IQ1) | $95,635 | $58,820 |
| Interquartile 75% (IQ3) | $142,548 | $82,023 |
| Interquartile Range (IQR) | $46,913 | $23,203 |
| Standard Deviation (Sample) | $49,625 | $16,513 |
| Standard Deviation (Population) | $49,259 | $16,226 |
Similar Demographics by Median Family Income
Demographics Similar to Immigrants from Spain by Median Family Income
In terms of median family income, the demographic groups most similar to Immigrants from Spain are Paraguayan ($114,016, a difference of 0.18%), Egyptian ($114,119, a difference of 0.27%), Immigrants from Serbia ($113,463, a difference of 0.31%), Immigrants from Bulgaria ($113,461, a difference of 0.31%), and Immigrants from Romania ($113,434, a difference of 0.34%).
| Demographics | Rating | Rank | Median Family Income |
| Immigrants | Latvia | 99.8 /100 | #60 | Exceptional $114,826 |
| Immigrants | Belarus | 99.8 /100 | #61 | Exceptional $114,586 |
| Mongolians | 99.8 /100 | #62 | Exceptional $114,553 |
| Immigrants | Pakistan | 99.8 /100 | #63 | Exceptional $114,406 |
| Immigrants | Scotland | 99.7 /100 | #64 | Exceptional $114,392 |
| Egyptians | 99.7 /100 | #65 | Exceptional $114,119 |
| Paraguayans | 99.7 /100 | #66 | Exceptional $114,016 |
| Immigrants | Spain | 99.7 /100 | #67 | Exceptional $113,815 |
| Immigrants | Serbia | 99.6 /100 | #68 | Exceptional $113,463 |
| Immigrants | Bulgaria | 99.6 /100 | #69 | Exceptional $113,461 |
| Immigrants | Romania | 99.6 /100 | #70 | Exceptional $113,434 |
| South Africans | 99.5 /100 | #71 | Exceptional $113,229 |
| Afghans | 99.5 /100 | #72 | Exceptional $112,971 |
| Laotians | 99.5 /100 | #73 | Exceptional $112,859 |
| Immigrants | Italy | 99.4 /100 | #74 | Exceptional $112,848 |
Demographics Similar to Houma by Median Family Income
In terms of median family income, the demographic groups most similar to Houma are Crow ($76,605, a difference of 0.55%), Pueblo ($76,880, a difference of 0.91%), Hopi ($77,188, a difference of 1.3%), Pima ($77,431, a difference of 1.6%), and Immigrants from Yemen ($77,457, a difference of 1.7%).
| Demographics | Rating | Rank | Median Family Income |
| Kiowa | 0.0 /100 | #333 | Tragic $80,885 |
| Menominee | 0.0 /100 | #334 | Tragic $79,563 |
| Yup'ik | 0.0 /100 | #335 | Tragic $79,290 |
| Immigrants | Cuba | 0.0 /100 | #336 | Tragic $78,249 |
| Yuman | 0.0 /100 | #337 | Tragic $78,055 |
| Immigrants | Yemen | 0.0 /100 | #338 | Tragic $77,457 |
| Pima | 0.0 /100 | #339 | Tragic $77,431 |
| Hopi | 0.0 /100 | #340 | Tragic $77,188 |
| Pueblo | 0.0 /100 | #341 | Tragic $76,880 |
| Crow | 0.0 /100 | #342 | Tragic $76,605 |
| Houma | 0.0 /100 | #343 | Tragic $76,188 |
| Tohono O'odham | 0.0 /100 | #344 | Tragic $72,193 |
| Navajo | 0.0 /100 | #345 | Tragic $70,989 |
| Puerto Ricans | 0.0 /100 | #346 | Tragic $70,423 |
| Lumbee | 0.0 /100 | #347 | Tragic $68,679 |