Immigrants from Spain vs Houma In Labor Force | Age 20-24
COMPARE
Immigrants from Spain
Houma
In Labor Force | Age 20-24
In Labor Force | Age 20-24 Comparison
Immigrants from Spain
Houma
73.2%
IN LABOR FORCE | AGE 20-24
0.1/ 100
METRIC RATING
282nd/ 347
METRIC RANK
73.7%
IN LABOR FORCE | AGE 20-24
0.6/ 100
METRIC RATING
261st/ 347
METRIC RANK
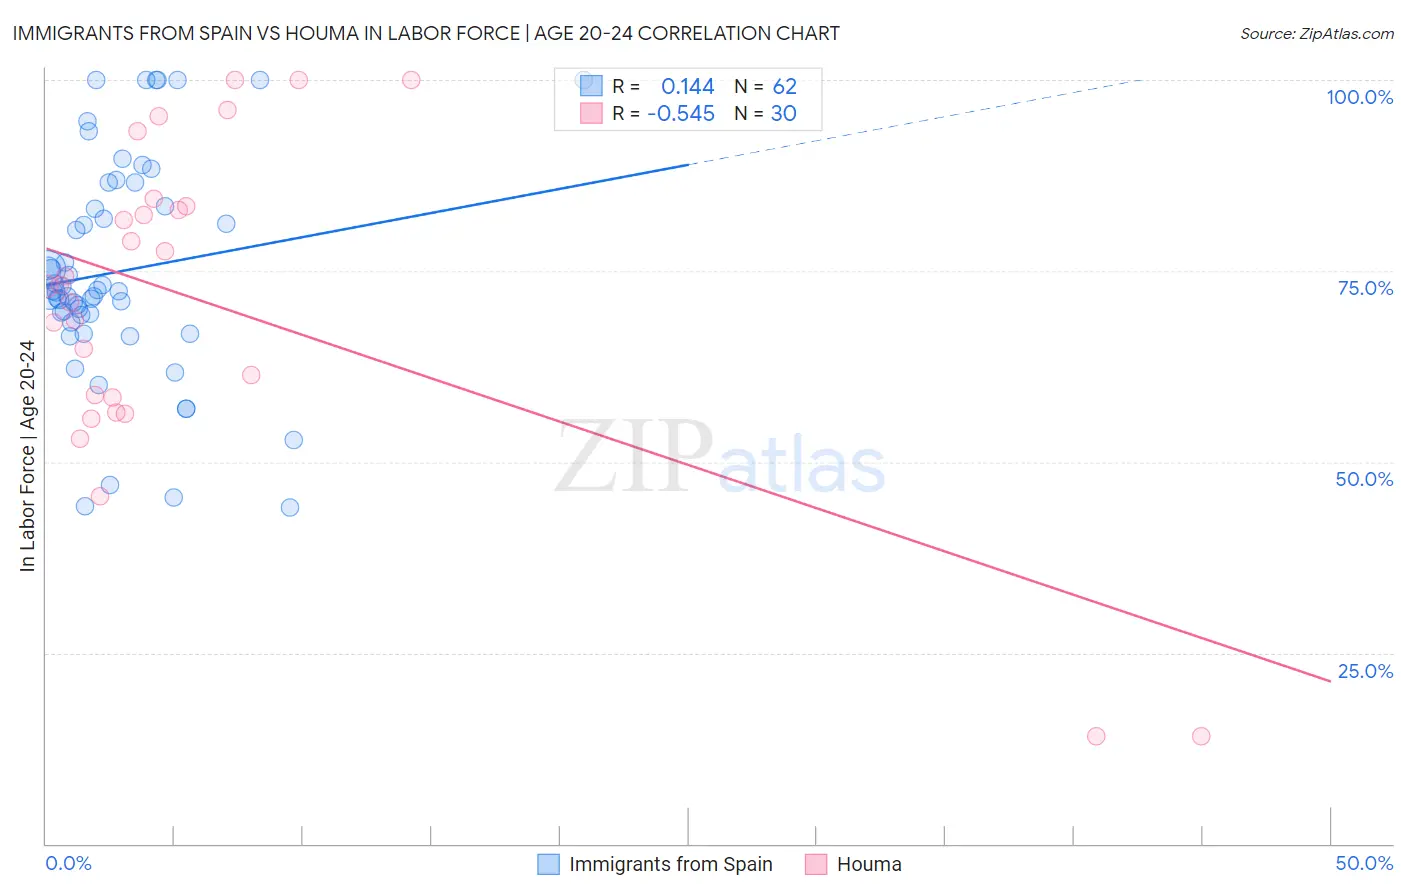
Immigrants from Spain vs Houma In Labor Force | Age 20-24 Correlation Chart
The statistical analysis conducted on geographies consisting of 239,648,988 people shows a poor positive correlation between the proportion of Immigrants from Spain and labor force participation rate among population between the ages 20 and 24 in the United States with a correlation coefficient (R) of 0.144 and weighted average of 73.2%. Similarly, the statistical analysis conducted on geographies consisting of 36,797,175 people shows a substantial negative correlation between the proportion of Houma and labor force participation rate among population between the ages 20 and 24 in the United States with a correlation coefficient (R) of -0.545 and weighted average of 73.7%, a difference of 0.59%.
In Labor Force | Age 20-24 Correlation Summary
| Measurement | Immigrants from Spain | Houma |
| Minimum | 44.1% | 14.1% |
| Maximum | 100.0% | 100.0% |
| Range | 55.9% | 85.9% |
| Mean | 74.9% | 70.7% |
| Median | 72.4% | 73.1% |
| Interquartile 25% (IQ1) | 69.2% | 58.4% |
| Interquartile 75% (IQ3) | 83.4% | 83.5% |
| Interquartile Range (IQR) | 14.2% | 25.1% |
| Standard Deviation (Sample) | 14.2% | 21.7% |
| Standard Deviation (Population) | 14.1% | 21.3% |
Similar Demographics by In Labor Force | Age 20-24
Demographics Similar to Immigrants from Spain by In Labor Force | Age 20-24
In terms of in labor force | age 20-24, the demographic groups most similar to Immigrants from Spain are Immigrants from Venezuela (73.2%, a difference of 0.010%), Immigrants from Bahamas (73.2%, a difference of 0.010%), Kiowa (73.2%, a difference of 0.030%), Bahamian (73.3%, a difference of 0.040%), and Nicaraguan (73.2%, a difference of 0.090%).
| Demographics | Rating | Rank | In Labor Force | Age 20-24 |
| Immigrants | South America | 0.2 /100 | #275 | Tragic 73.3% |
| Mongolians | 0.2 /100 | #276 | Tragic 73.3% |
| Immigrants | Malaysia | 0.2 /100 | #277 | Tragic 73.3% |
| Cypriots | 0.2 /100 | #278 | Tragic 73.3% |
| Venezuelans | 0.2 /100 | #279 | Tragic 73.3% |
| Bahamians | 0.1 /100 | #280 | Tragic 73.3% |
| Immigrants | Venezuela | 0.1 /100 | #281 | Tragic 73.2% |
| Immigrants | Spain | 0.1 /100 | #282 | Tragic 73.2% |
| Immigrants | Bahamas | 0.1 /100 | #283 | Tragic 73.2% |
| Kiowa | 0.1 /100 | #284 | Tragic 73.2% |
| Nicaraguans | 0.1 /100 | #285 | Tragic 73.2% |
| Immigrants | Lebanon | 0.1 /100 | #286 | Tragic 73.1% |
| Immigrants | Korea | 0.1 /100 | #287 | Tragic 73.1% |
| Argentineans | 0.1 /100 | #288 | Tragic 73.1% |
| U.S. Virgin Islanders | 0.1 /100 | #289 | Tragic 73.0% |
Demographics Similar to Houma by In Labor Force | Age 20-24
In terms of in labor force | age 20-24, the demographic groups most similar to Houma are Immigrants from Turkey (73.7%, a difference of 0.010%), Asian (73.7%, a difference of 0.010%), Egyptian (73.7%, a difference of 0.040%), Dutch West Indian (73.7%, a difference of 0.040%), and Paraguayan (73.7%, a difference of 0.080%).
| Demographics | Rating | Rank | In Labor Force | Age 20-24 |
| Ute | 1.0 /100 | #254 | Tragic 73.8% |
| Immigrants | Pakistan | 0.9 /100 | #255 | Tragic 73.8% |
| Spanish American Indians | 0.8 /100 | #256 | Tragic 73.7% |
| Paraguayans | 0.8 /100 | #257 | Tragic 73.7% |
| Egyptians | 0.7 /100 | #258 | Tragic 73.7% |
| Dutch West Indians | 0.7 /100 | #259 | Tragic 73.7% |
| Immigrants | Turkey | 0.7 /100 | #260 | Tragic 73.7% |
| Houma | 0.6 /100 | #261 | Tragic 73.7% |
| Asians | 0.6 /100 | #262 | Tragic 73.7% |
| Immigrants | Asia | 0.5 /100 | #263 | Tragic 73.6% |
| Immigrants | Haiti | 0.5 /100 | #264 | Tragic 73.6% |
| Burmese | 0.5 /100 | #265 | Tragic 73.6% |
| Haitians | 0.5 /100 | #266 | Tragic 73.6% |
| Immigrants | Western Asia | 0.4 /100 | #267 | Tragic 73.5% |
| South Americans | 0.4 /100 | #268 | Tragic 73.5% |