Immigrants from Serbia vs Puerto Rican College, Under 1 year
COMPARE
Immigrants from Serbia
Puerto Rican
College, Under 1 year
College, Under 1 year Comparison
Immigrants from Serbia
Puerto Ricans
69.3%
COLLEGE, UNDER 1 YEAR
99.5/ 100
METRIC RATING
59th/ 347
METRIC RANK
56.8%
COLLEGE, UNDER 1 YEAR
0.0/ 100
METRIC RATING
319th/ 347
METRIC RANK
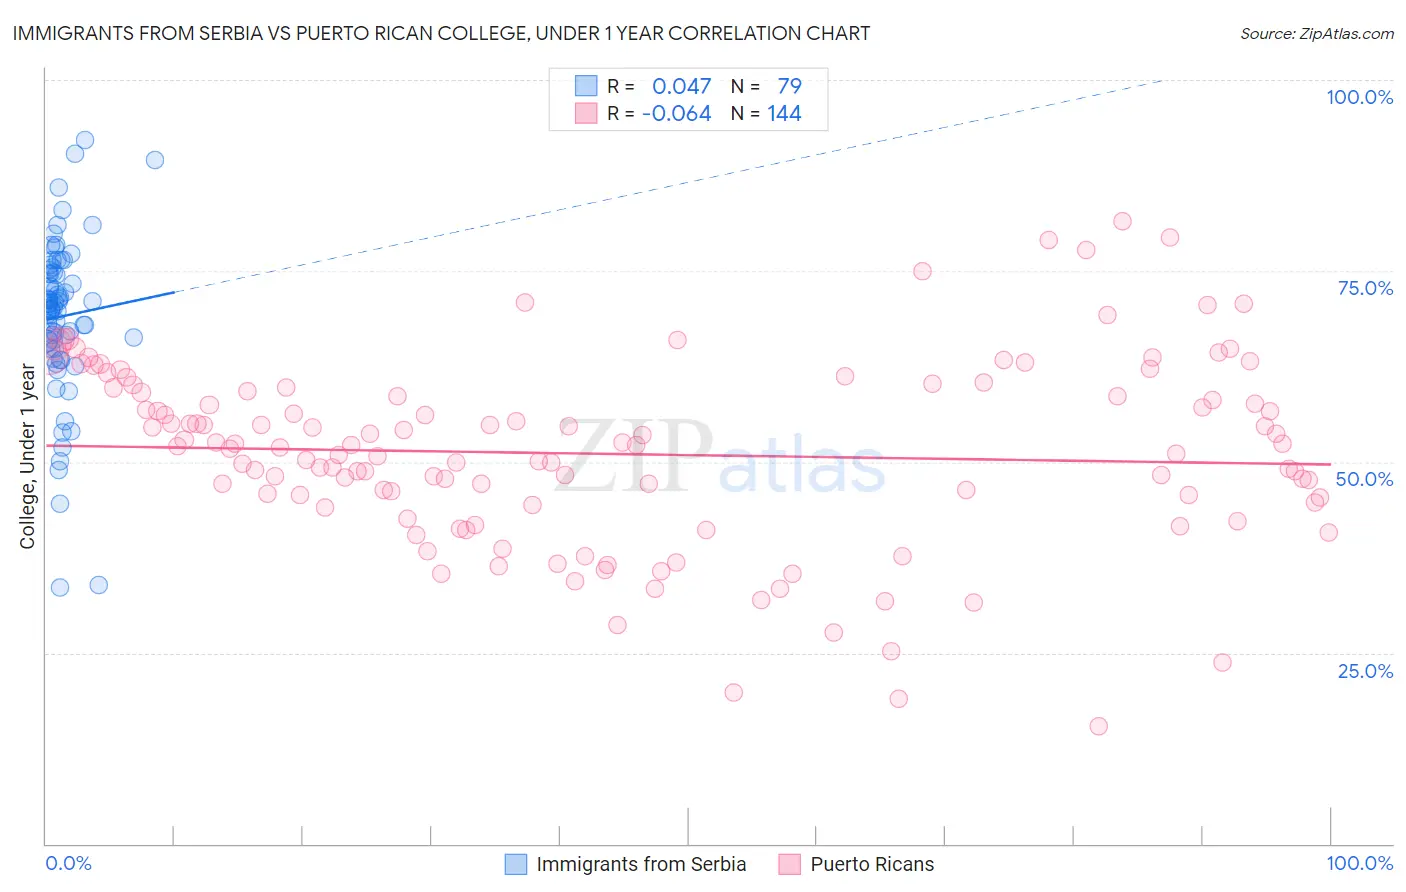
Immigrants from Serbia vs Puerto Rican College, Under 1 year Correlation Chart
The statistical analysis conducted on geographies consisting of 131,742,571 people shows no correlation between the proportion of Immigrants from Serbia and percentage of population with at least college, under 1 year education in the United States with a correlation coefficient (R) of 0.047 and weighted average of 69.3%. Similarly, the statistical analysis conducted on geographies consisting of 528,317,754 people shows a slight negative correlation between the proportion of Puerto Ricans and percentage of population with at least college, under 1 year education in the United States with a correlation coefficient (R) of -0.064 and weighted average of 56.8%, a difference of 21.9%.
College, Under 1 year Correlation Summary
| Measurement | Immigrants from Serbia | Puerto Rican |
| Minimum | 33.6% | 15.4% |
| Maximum | 92.2% | 81.5% |
| Range | 58.6% | 66.1% |
| Mean | 69.0% | 51.0% |
| Median | 70.1% | 52.0% |
| Interquartile 25% (IQ1) | 65.8% | 44.5% |
| Interquartile 75% (IQ3) | 74.7% | 59.2% |
| Interquartile Range (IQR) | 8.9% | 14.7% |
| Standard Deviation (Sample) | 10.5% | 12.2% |
| Standard Deviation (Population) | 10.4% | 12.2% |
Similar Demographics by College, Under 1 year
Demographics Similar to Immigrants from Serbia by College, Under 1 year
In terms of college, under 1 year, the demographic groups most similar to Immigrants from Serbia are Immigrants from Asia (69.2%, a difference of 0.090%), Immigrants from Malaysia (69.3%, a difference of 0.13%), Immigrants from Kazakhstan (69.2%, a difference of 0.13%), Immigrants from Belarus (69.2%, a difference of 0.13%), and Asian (69.4%, a difference of 0.23%).
| Demographics | Rating | Rank | College, Under 1 year |
| Immigrants | Russia | 99.8 /100 | #52 | Exceptional 69.9% |
| South Africans | 99.7 /100 | #53 | Exceptional 69.7% |
| Immigrants | Czechoslovakia | 99.7 /100 | #54 | Exceptional 69.6% |
| Maltese | 99.7 /100 | #55 | Exceptional 69.5% |
| Immigrants | Scotland | 99.6 /100 | #56 | Exceptional 69.4% |
| Asians | 99.6 /100 | #57 | Exceptional 69.4% |
| Immigrants | Malaysia | 99.6 /100 | #58 | Exceptional 69.3% |
| Immigrants | Serbia | 99.5 /100 | #59 | Exceptional 69.3% |
| Immigrants | Asia | 99.5 /100 | #60 | Exceptional 69.2% |
| Immigrants | Kazakhstan | 99.5 /100 | #61 | Exceptional 69.2% |
| Immigrants | Belarus | 99.5 /100 | #62 | Exceptional 69.2% |
| Immigrants | Canada | 99.4 /100 | #63 | Exceptional 69.1% |
| Northern Europeans | 99.4 /100 | #64 | Exceptional 69.0% |
| Immigrants | Moldova | 99.3 /100 | #65 | Exceptional 69.0% |
| Immigrants | North America | 99.3 /100 | #66 | Exceptional 69.0% |
Demographics Similar to Puerto Ricans by College, Under 1 year
In terms of college, under 1 year, the demographic groups most similar to Puerto Ricans are Guatemalan (56.8%, a difference of 0.060%), Immigrants from Haiti (56.9%, a difference of 0.20%), Hispanic or Latino (57.0%, a difference of 0.32%), Native/Alaskan (56.6%, a difference of 0.32%), and Menominee (57.0%, a difference of 0.36%).
| Demographics | Rating | Rank | College, Under 1 year |
| Salvadorans | 0.0 /100 | #312 | Tragic 57.3% |
| Dutch West Indians | 0.0 /100 | #313 | Tragic 57.2% |
| Hopi | 0.0 /100 | #314 | Tragic 57.1% |
| Hondurans | 0.0 /100 | #315 | Tragic 57.1% |
| Menominee | 0.0 /100 | #316 | Tragic 57.0% |
| Hispanics or Latinos | 0.0 /100 | #317 | Tragic 57.0% |
| Immigrants | Haiti | 0.0 /100 | #318 | Tragic 56.9% |
| Puerto Ricans | 0.0 /100 | #319 | Tragic 56.8% |
| Guatemalans | 0.0 /100 | #320 | Tragic 56.8% |
| Natives/Alaskans | 0.0 /100 | #321 | Tragic 56.6% |
| Immigrants | Caribbean | 0.0 /100 | #322 | Tragic 56.6% |
| Immigrants | Honduras | 0.0 /100 | #323 | Tragic 56.5% |
| Immigrants | El Salvador | 0.0 /100 | #324 | Tragic 56.4% |
| Immigrants | Latin America | 0.0 /100 | #325 | Tragic 56.3% |
| Navajo | 0.0 /100 | #326 | Tragic 56.3% |