Immigrants from Serbia vs Immigrants from Netherlands College, Under 1 year
COMPARE
Immigrants from Serbia
Immigrants from Netherlands
College, Under 1 year
College, Under 1 year Comparison
Immigrants from Serbia
Immigrants from Netherlands
69.3%
COLLEGE, UNDER 1 YEAR
99.5/ 100
METRIC RATING
59th/ 347
METRIC RANK
70.0%
COLLEGE, UNDER 1 YEAR
99.8/ 100
METRIC RATING
48th/ 347
METRIC RANK
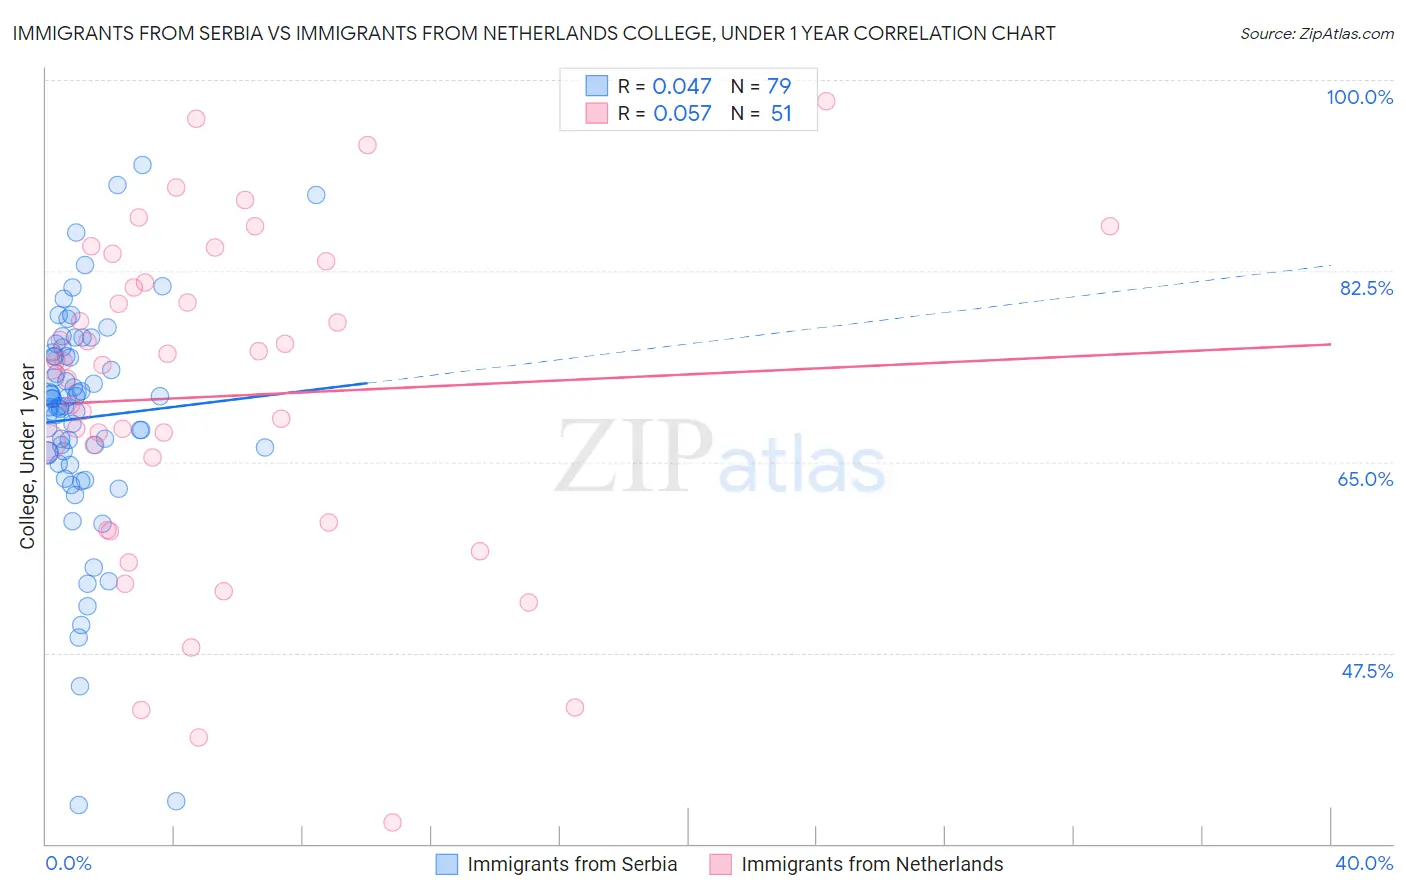
Immigrants from Serbia vs Immigrants from Netherlands College, Under 1 year Correlation Chart
The statistical analysis conducted on geographies consisting of 131,742,571 people shows no correlation between the proportion of Immigrants from Serbia and percentage of population with at least college, under 1 year education in the United States with a correlation coefficient (R) of 0.047 and weighted average of 69.3%. Similarly, the statistical analysis conducted on geographies consisting of 237,877,405 people shows a slight positive correlation between the proportion of Immigrants from Netherlands and percentage of population with at least college, under 1 year education in the United States with a correlation coefficient (R) of 0.057 and weighted average of 70.0%, a difference of 1.1%.
College, Under 1 year Correlation Summary
| Measurement | Immigrants from Serbia | Immigrants from Netherlands |
| Minimum | 33.6% | 32.0% |
| Maximum | 92.2% | 98.1% |
| Range | 58.6% | 66.1% |
| Mean | 69.0% | 71.0% |
| Median | 70.1% | 73.9% |
| Interquartile 25% (IQ1) | 65.8% | 59.4% |
| Interquartile 75% (IQ3) | 74.7% | 81.4% |
| Interquartile Range (IQR) | 8.9% | 22.0% |
| Standard Deviation (Sample) | 10.5% | 15.0% |
| Standard Deviation (Population) | 10.4% | 14.9% |
Demographics Similar to Immigrants from Serbia and Immigrants from Netherlands by College, Under 1 year
In terms of college, under 1 year, the demographic groups most similar to Immigrants from Serbia are Immigrants from Asia (69.2%, a difference of 0.090%), Immigrants from Malaysia (69.3%, a difference of 0.13%), Immigrants from Kazakhstan (69.2%, a difference of 0.13%), Immigrants from Belarus (69.2%, a difference of 0.13%), and Asian (69.4%, a difference of 0.23%). Similarly, the demographic groups most similar to Immigrants from Netherlands are Immigrants from Austria (70.0%, a difference of 0.040%), Immigrants from Bulgaria (70.0%, a difference of 0.060%), Zimbabwean (69.9%, a difference of 0.16%), Immigrants from Latvia (70.1%, a difference of 0.17%), and Mongolian (69.9%, a difference of 0.20%).
| Demographics | Rating | Rank | College, Under 1 year |
| Israelis | 99.9 /100 | #43 | Exceptional 70.2% |
| New Zealanders | 99.9 /100 | #44 | Exceptional 70.2% |
| Immigrants | Norway | 99.9 /100 | #45 | Exceptional 70.2% |
| Immigrants | Latvia | 99.9 /100 | #46 | Exceptional 70.1% |
| Immigrants | Bulgaria | 99.8 /100 | #47 | Exceptional 70.0% |
| Immigrants | Netherlands | 99.8 /100 | #48 | Exceptional 70.0% |
| Immigrants | Austria | 99.8 /100 | #49 | Exceptional 70.0% |
| Zimbabweans | 99.8 /100 | #50 | Exceptional 69.9% |
| Mongolians | 99.8 /100 | #51 | Exceptional 69.9% |
| Immigrants | Russia | 99.8 /100 | #52 | Exceptional 69.9% |
| South Africans | 99.7 /100 | #53 | Exceptional 69.7% |
| Immigrants | Czechoslovakia | 99.7 /100 | #54 | Exceptional 69.6% |
| Maltese | 99.7 /100 | #55 | Exceptional 69.5% |
| Immigrants | Scotland | 99.6 /100 | #56 | Exceptional 69.4% |
| Asians | 99.6 /100 | #57 | Exceptional 69.4% |
| Immigrants | Malaysia | 99.6 /100 | #58 | Exceptional 69.3% |
| Immigrants | Serbia | 99.5 /100 | #59 | Exceptional 69.3% |
| Immigrants | Asia | 99.5 /100 | #60 | Exceptional 69.2% |
| Immigrants | Kazakhstan | 99.5 /100 | #61 | Exceptional 69.2% |
| Immigrants | Belarus | 99.5 /100 | #62 | Exceptional 69.2% |
| Immigrants | Canada | 99.4 /100 | #63 | Exceptional 69.1% |