Immigrants from Serbia vs Puerto Rican In Labor Force | Age 16-19
COMPARE
Immigrants from Serbia
Puerto Rican
In Labor Force | Age 16-19
In Labor Force | Age 16-19 Comparison
Immigrants from Serbia
Puerto Ricans
36.0%
IN LABOR FORCE | AGE 16-19
21.0/ 100
METRIC RATING
197th/ 347
METRIC RANK
30.3%
IN LABOR FORCE | AGE 16-19
0.0/ 100
METRIC RATING
334th/ 347
METRIC RANK
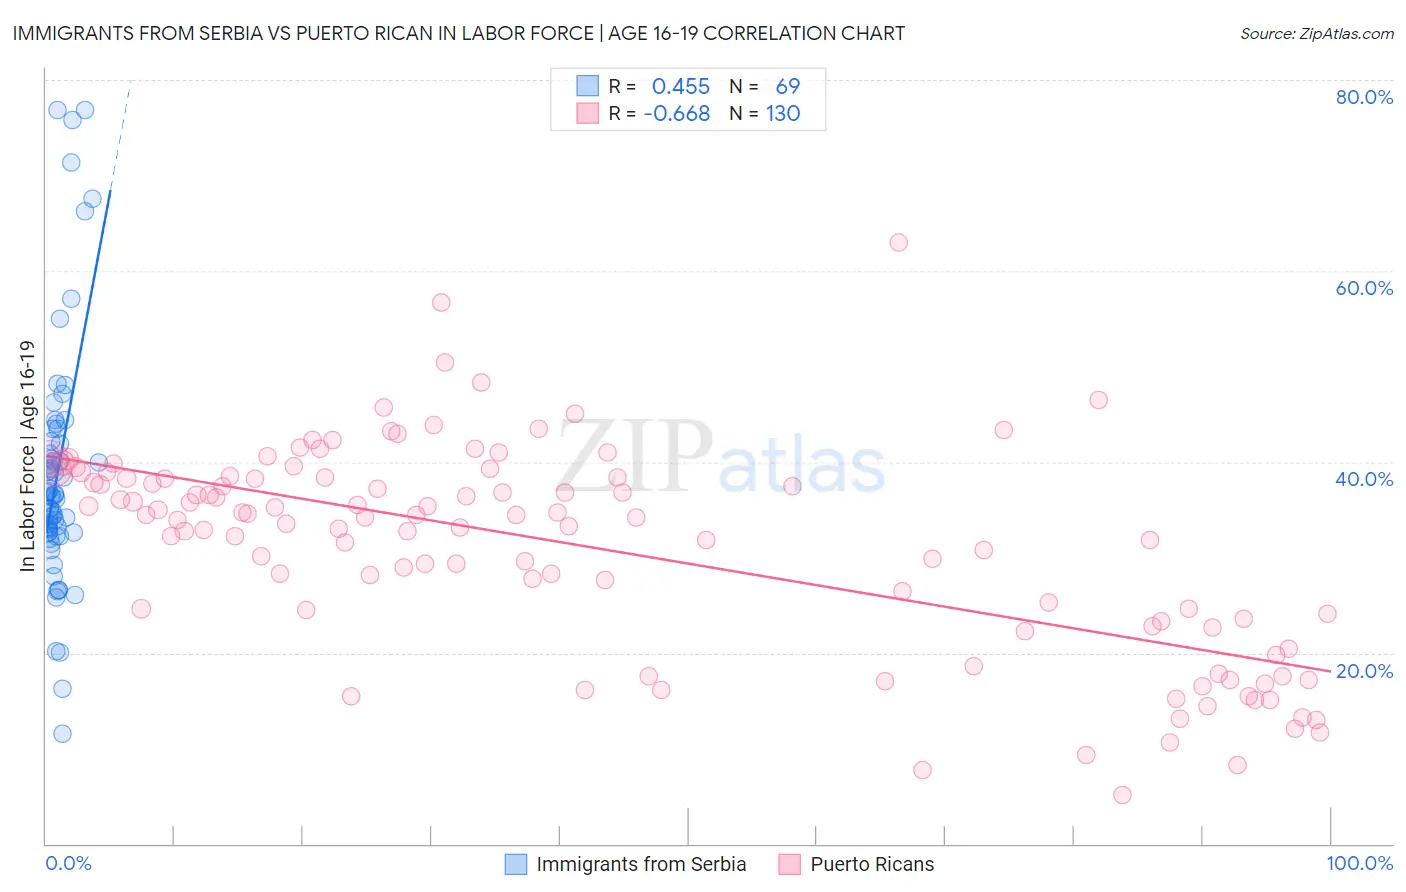
Immigrants from Serbia vs Puerto Rican In Labor Force | Age 16-19 Correlation Chart
The statistical analysis conducted on geographies consisting of 131,679,358 people shows a moderate positive correlation between the proportion of Immigrants from Serbia and labor force participation rate among population between the ages 16 and 19 in the United States with a correlation coefficient (R) of 0.455 and weighted average of 36.0%. Similarly, the statistical analysis conducted on geographies consisting of 526,303,316 people shows a significant negative correlation between the proportion of Puerto Ricans and labor force participation rate among population between the ages 16 and 19 in the United States with a correlation coefficient (R) of -0.668 and weighted average of 30.3%, a difference of 18.5%.
In Labor Force | Age 16-19 Correlation Summary
| Measurement | Immigrants from Serbia | Puerto Rican |
| Minimum | 11.5% | 5.1% |
| Maximum | 76.8% | 63.0% |
| Range | 65.3% | 57.9% |
| Mean | 39.0% | 31.0% |
| Median | 36.5% | 34.0% |
| Interquartile 25% (IQ1) | 32.6% | 23.4% |
| Interquartile 75% (IQ3) | 42.8% | 38.3% |
| Interquartile Range (IQR) | 10.2% | 14.9% |
| Standard Deviation (Sample) | 13.1% | 10.9% |
| Standard Deviation (Population) | 13.0% | 10.8% |
Similar Demographics by In Labor Force | Age 16-19
Demographics Similar to Immigrants from Serbia by In Labor Force | Age 16-19
In terms of in labor force | age 16-19, the demographic groups most similar to Immigrants from Serbia are Mexican American Indian (36.0%, a difference of 0.010%), Immigrants from Northern Africa (35.9%, a difference of 0.080%), Immigrants from Norway (35.9%, a difference of 0.090%), Bolivian (36.0%, a difference of 0.17%), and Immigrants from Sweden (35.9%, a difference of 0.17%).
| Demographics | Rating | Rank | In Labor Force | Age 16-19 |
| Panamanians | 28.6 /100 | #190 | Fair 36.1% |
| Immigrants | Croatia | 27.5 /100 | #191 | Fair 36.1% |
| Afghans | 25.7 /100 | #192 | Fair 36.1% |
| Immigrants | Denmark | 25.0 /100 | #193 | Fair 36.1% |
| Nigerians | 24.6 /100 | #194 | Fair 36.1% |
| Bolivians | 23.3 /100 | #195 | Fair 36.0% |
| Mexican American Indians | 21.1 /100 | #196 | Fair 36.0% |
| Immigrants | Serbia | 21.0 /100 | #197 | Fair 36.0% |
| Immigrants | Northern Africa | 19.9 /100 | #198 | Poor 35.9% |
| Immigrants | Norway | 19.8 /100 | #199 | Poor 35.9% |
| Immigrants | Sweden | 18.8 /100 | #200 | Poor 35.9% |
| Alsatians | 17.5 /100 | #201 | Poor 35.9% |
| Senegalese | 17.4 /100 | #202 | Poor 35.9% |
| Immigrants | Nigeria | 16.8 /100 | #203 | Poor 35.8% |
| Immigrants | Albania | 15.0 /100 | #204 | Poor 35.8% |
Demographics Similar to Puerto Ricans by In Labor Force | Age 16-19
In terms of in labor force | age 16-19, the demographic groups most similar to Puerto Ricans are Immigrants from Cuba (30.2%, a difference of 0.33%), Immigrants from Hong Kong (30.5%, a difference of 0.42%), Immigrants from Israel (30.5%, a difference of 0.44%), Immigrants from Trinidad and Tobago (30.2%, a difference of 0.62%), and Immigrants from Bangladesh (30.0%, a difference of 0.99%).
| Demographics | Rating | Rank | In Labor Force | Age 16-19 |
| Immigrants | Taiwan | 0.0 /100 | #327 | Tragic 31.0% |
| Immigrants | Ecuador | 0.0 /100 | #328 | Tragic 31.0% |
| Barbadians | 0.0 /100 | #329 | Tragic 31.0% |
| Lumbee | 0.0 /100 | #330 | Tragic 31.0% |
| Trinidadians and Tobagonians | 0.0 /100 | #331 | Tragic 30.9% |
| Immigrants | Israel | 0.0 /100 | #332 | Tragic 30.5% |
| Immigrants | Hong Kong | 0.0 /100 | #333 | Tragic 30.5% |
| Puerto Ricans | 0.0 /100 | #334 | Tragic 30.3% |
| Immigrants | Cuba | 0.0 /100 | #335 | Tragic 30.2% |
| Immigrants | Trinidad and Tobago | 0.0 /100 | #336 | Tragic 30.2% |
| Immigrants | Bangladesh | 0.0 /100 | #337 | Tragic 30.0% |
| Vietnamese | 0.0 /100 | #338 | Tragic 29.6% |
| Immigrants | Uzbekistan | 0.0 /100 | #339 | Tragic 29.2% |
| British West Indians | 0.0 /100 | #340 | Tragic 29.1% |
| Immigrants | Armenia | 0.0 /100 | #341 | Tragic 29.0% |