Immigrants from Pakistan vs Puerto Rican College, Under 1 year
COMPARE
Immigrants from Pakistan
Puerto Rican
College, Under 1 year
College, Under 1 year Comparison
Immigrants from Pakistan
Puerto Ricans
68.0%
COLLEGE, UNDER 1 YEAR
97.5/ 100
METRIC RATING
95th/ 347
METRIC RANK
56.8%
COLLEGE, UNDER 1 YEAR
0.0/ 100
METRIC RATING
319th/ 347
METRIC RANK
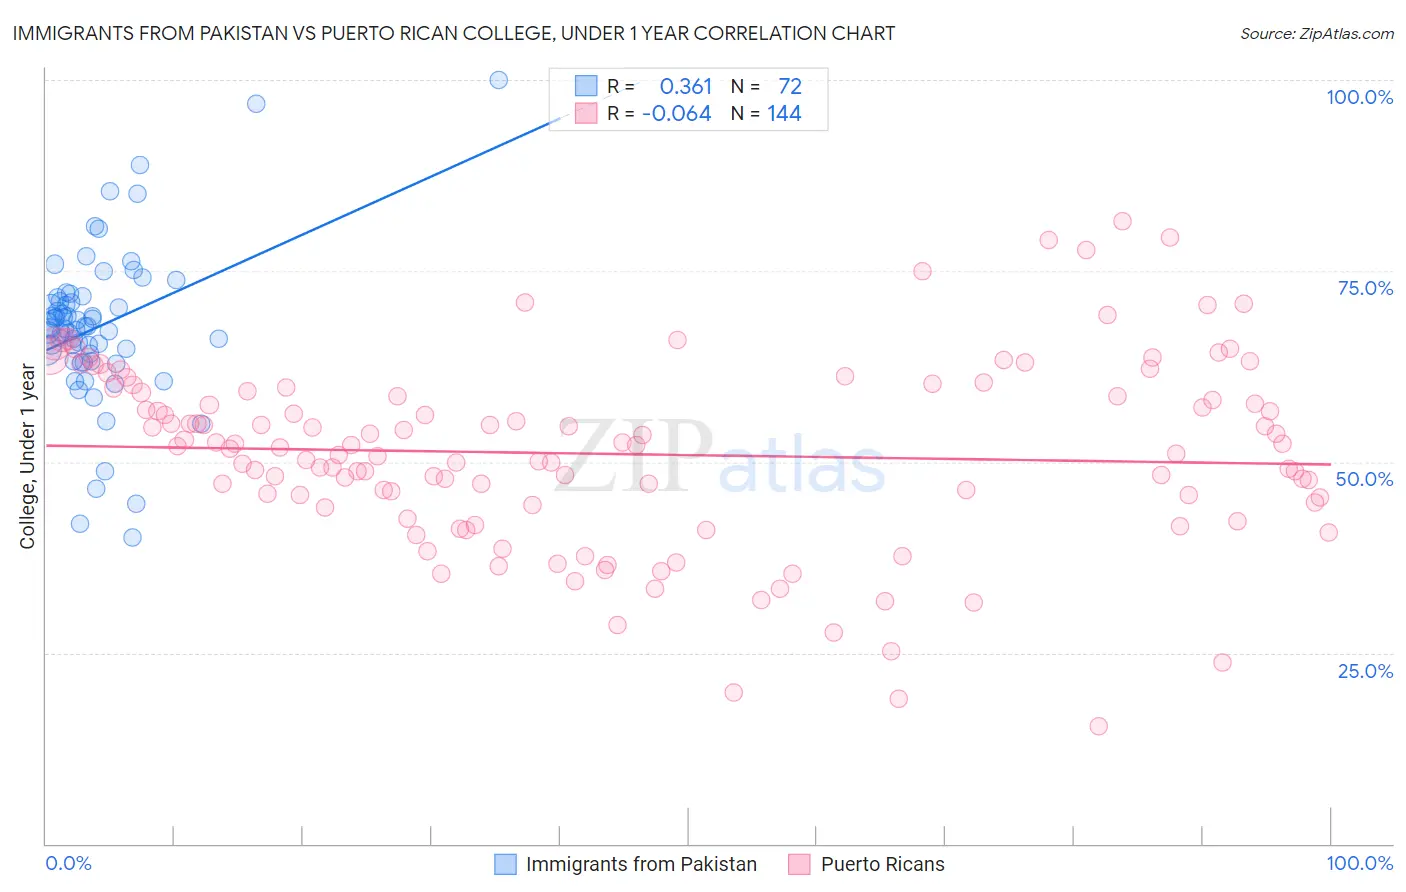
Immigrants from Pakistan vs Puerto Rican College, Under 1 year Correlation Chart
The statistical analysis conducted on geographies consisting of 283,911,472 people shows a mild positive correlation between the proportion of Immigrants from Pakistan and percentage of population with at least college, under 1 year education in the United States with a correlation coefficient (R) of 0.361 and weighted average of 68.0%. Similarly, the statistical analysis conducted on geographies consisting of 528,317,754 people shows a slight negative correlation between the proportion of Puerto Ricans and percentage of population with at least college, under 1 year education in the United States with a correlation coefficient (R) of -0.064 and weighted average of 56.8%, a difference of 19.7%.
College, Under 1 year Correlation Summary
| Measurement | Immigrants from Pakistan | Puerto Rican |
| Minimum | 40.0% | 15.4% |
| Maximum | 100.0% | 81.5% |
| Range | 60.0% | 66.1% |
| Mean | 67.7% | 51.0% |
| Median | 67.6% | 52.0% |
| Interquartile 25% (IQ1) | 63.6% | 44.5% |
| Interquartile 75% (IQ3) | 71.2% | 59.2% |
| Interquartile Range (IQR) | 7.6% | 14.7% |
| Standard Deviation (Sample) | 10.3% | 12.2% |
| Standard Deviation (Population) | 10.2% | 12.2% |
Similar Demographics by College, Under 1 year
Demographics Similar to Immigrants from Pakistan by College, Under 1 year
In terms of college, under 1 year, the demographic groups most similar to Immigrants from Pakistan are Jordanian (68.0%, a difference of 0.030%), Immigrants from Ethiopia (68.0%, a difference of 0.060%), Armenian (68.1%, a difference of 0.090%), Paraguayan (67.9%, a difference of 0.17%), and Immigrants from Bolivia (67.9%, a difference of 0.18%).
| Demographics | Rating | Rank | College, Under 1 year |
| Croatians | 98.2 /100 | #88 | Exceptional 68.3% |
| Ethiopians | 98.2 /100 | #89 | Exceptional 68.3% |
| Icelanders | 98.1 /100 | #90 | Exceptional 68.3% |
| Europeans | 98.1 /100 | #91 | Exceptional 68.2% |
| Luxembourgers | 98.1 /100 | #92 | Exceptional 68.2% |
| Romanians | 97.9 /100 | #93 | Exceptional 68.2% |
| Armenians | 97.7 /100 | #94 | Exceptional 68.1% |
| Immigrants | Pakistan | 97.5 /100 | #95 | Exceptional 68.0% |
| Jordanians | 97.4 /100 | #96 | Exceptional 68.0% |
| Immigrants | Ethiopia | 97.3 /100 | #97 | Exceptional 68.0% |
| Paraguayans | 97.1 /100 | #98 | Exceptional 67.9% |
| Immigrants | Bolivia | 97.0 /100 | #99 | Exceptional 67.9% |
| Immigrants | Argentina | 97.0 /100 | #100 | Exceptional 67.9% |
| Immigrants | Eastern Europe | 96.9 /100 | #101 | Exceptional 67.9% |
| Palestinians | 96.9 /100 | #102 | Exceptional 67.9% |
Demographics Similar to Puerto Ricans by College, Under 1 year
In terms of college, under 1 year, the demographic groups most similar to Puerto Ricans are Guatemalan (56.8%, a difference of 0.060%), Immigrants from Haiti (56.9%, a difference of 0.20%), Hispanic or Latino (57.0%, a difference of 0.32%), Native/Alaskan (56.6%, a difference of 0.32%), and Menominee (57.0%, a difference of 0.36%).
| Demographics | Rating | Rank | College, Under 1 year |
| Salvadorans | 0.0 /100 | #312 | Tragic 57.3% |
| Dutch West Indians | 0.0 /100 | #313 | Tragic 57.2% |
| Hopi | 0.0 /100 | #314 | Tragic 57.1% |
| Hondurans | 0.0 /100 | #315 | Tragic 57.1% |
| Menominee | 0.0 /100 | #316 | Tragic 57.0% |
| Hispanics or Latinos | 0.0 /100 | #317 | Tragic 57.0% |
| Immigrants | Haiti | 0.0 /100 | #318 | Tragic 56.9% |
| Puerto Ricans | 0.0 /100 | #319 | Tragic 56.8% |
| Guatemalans | 0.0 /100 | #320 | Tragic 56.8% |
| Natives/Alaskans | 0.0 /100 | #321 | Tragic 56.6% |
| Immigrants | Caribbean | 0.0 /100 | #322 | Tragic 56.6% |
| Immigrants | Honduras | 0.0 /100 | #323 | Tragic 56.5% |
| Immigrants | El Salvador | 0.0 /100 | #324 | Tragic 56.4% |
| Immigrants | Latin America | 0.0 /100 | #325 | Tragic 56.3% |
| Navajo | 0.0 /100 | #326 | Tragic 56.3% |