Immigrants from Serbia vs Immigrants from Cuba College, Under 1 year
COMPARE
Immigrants from Serbia
Immigrants from Cuba
College, Under 1 year
College, Under 1 year Comparison
Immigrants from Serbia
Immigrants from Cuba
69.3%
COLLEGE, UNDER 1 YEAR
99.5/ 100
METRIC RATING
59th/ 347
METRIC RANK
55.7%
COLLEGE, UNDER 1 YEAR
0.0/ 100
METRIC RATING
329th/ 347
METRIC RANK
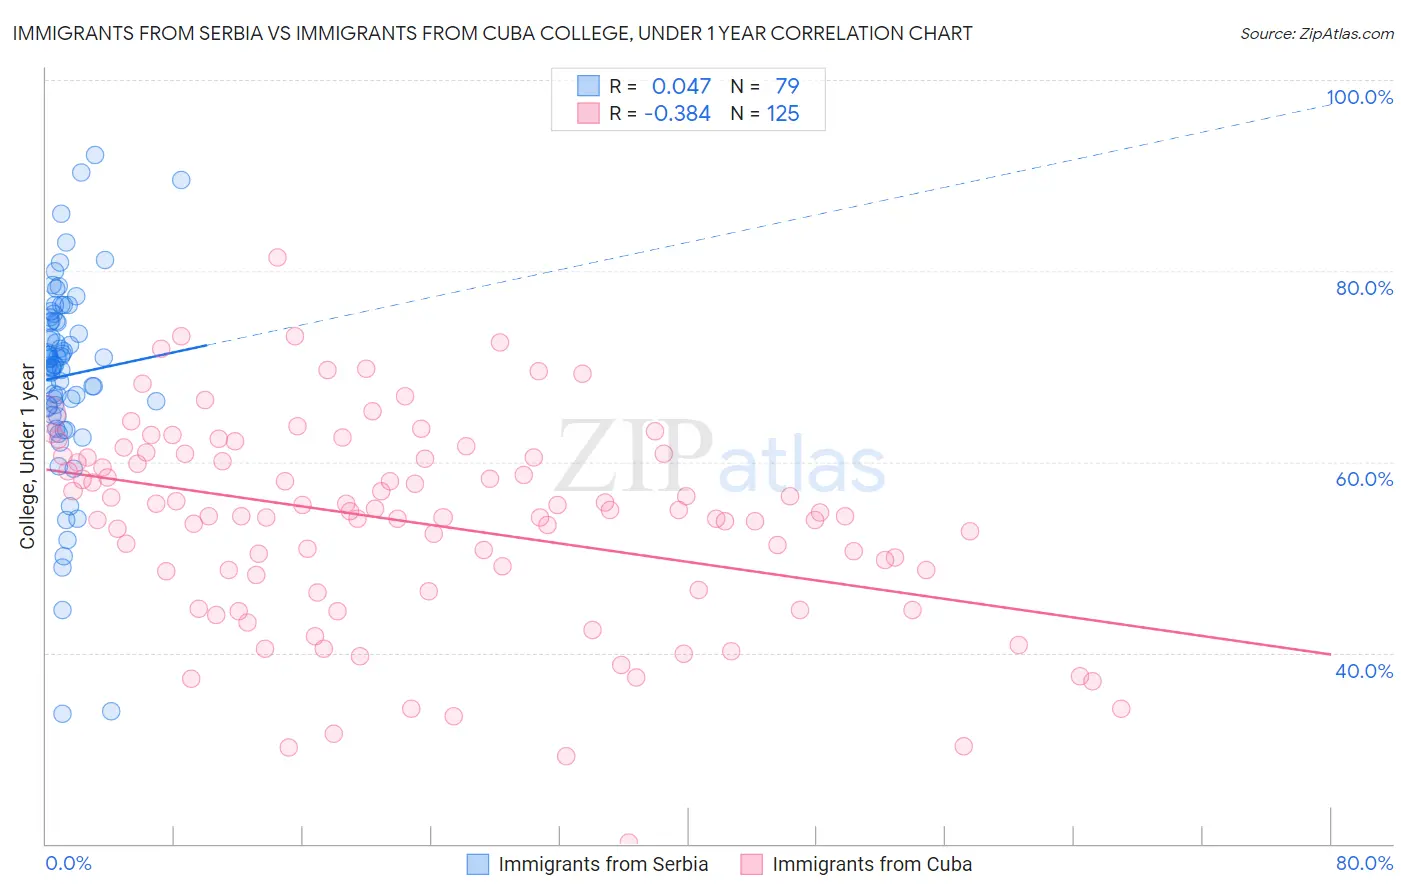
Immigrants from Serbia vs Immigrants from Cuba College, Under 1 year Correlation Chart
The statistical analysis conducted on geographies consisting of 131,742,571 people shows no correlation between the proportion of Immigrants from Serbia and percentage of population with at least college, under 1 year education in the United States with a correlation coefficient (R) of 0.047 and weighted average of 69.3%. Similarly, the statistical analysis conducted on geographies consisting of 326,030,333 people shows a mild negative correlation between the proportion of Immigrants from Cuba and percentage of population with at least college, under 1 year education in the United States with a correlation coefficient (R) of -0.384 and weighted average of 55.7%, a difference of 24.3%.
College, Under 1 year Correlation Summary
| Measurement | Immigrants from Serbia | Immigrants from Cuba |
| Minimum | 33.6% | 20.1% |
| Maximum | 92.2% | 81.5% |
| Range | 58.6% | 61.4% |
| Mean | 69.0% | 53.6% |
| Median | 70.1% | 54.6% |
| Interquartile 25% (IQ1) | 65.8% | 47.4% |
| Interquartile 75% (IQ3) | 74.7% | 60.6% |
| Interquartile Range (IQR) | 8.9% | 13.2% |
| Standard Deviation (Sample) | 10.5% | 10.6% |
| Standard Deviation (Population) | 10.4% | 10.6% |
Similar Demographics by College, Under 1 year
Demographics Similar to Immigrants from Serbia by College, Under 1 year
In terms of college, under 1 year, the demographic groups most similar to Immigrants from Serbia are Immigrants from Asia (69.2%, a difference of 0.090%), Immigrants from Malaysia (69.3%, a difference of 0.13%), Immigrants from Kazakhstan (69.2%, a difference of 0.13%), Immigrants from Belarus (69.2%, a difference of 0.13%), and Asian (69.4%, a difference of 0.23%).
| Demographics | Rating | Rank | College, Under 1 year |
| Immigrants | Russia | 99.8 /100 | #52 | Exceptional 69.9% |
| South Africans | 99.7 /100 | #53 | Exceptional 69.7% |
| Immigrants | Czechoslovakia | 99.7 /100 | #54 | Exceptional 69.6% |
| Maltese | 99.7 /100 | #55 | Exceptional 69.5% |
| Immigrants | Scotland | 99.6 /100 | #56 | Exceptional 69.4% |
| Asians | 99.6 /100 | #57 | Exceptional 69.4% |
| Immigrants | Malaysia | 99.6 /100 | #58 | Exceptional 69.3% |
| Immigrants | Serbia | 99.5 /100 | #59 | Exceptional 69.3% |
| Immigrants | Asia | 99.5 /100 | #60 | Exceptional 69.2% |
| Immigrants | Kazakhstan | 99.5 /100 | #61 | Exceptional 69.2% |
| Immigrants | Belarus | 99.5 /100 | #62 | Exceptional 69.2% |
| Immigrants | Canada | 99.4 /100 | #63 | Exceptional 69.1% |
| Northern Europeans | 99.4 /100 | #64 | Exceptional 69.0% |
| Immigrants | Moldova | 99.3 /100 | #65 | Exceptional 69.0% |
| Immigrants | North America | 99.3 /100 | #66 | Exceptional 69.0% |
Demographics Similar to Immigrants from Cuba by College, Under 1 year
In terms of college, under 1 year, the demographic groups most similar to Immigrants from Cuba are Mexican (55.6%, a difference of 0.13%), Dominican (55.5%, a difference of 0.40%), Cape Verdean (56.0%, a difference of 0.62%), Immigrants from Yemen (55.3%, a difference of 0.80%), and Immigrants from Guatemala (56.2%, a difference of 0.91%).
| Demographics | Rating | Rank | College, Under 1 year |
| Immigrants | Caribbean | 0.0 /100 | #322 | Tragic 56.6% |
| Immigrants | Honduras | 0.0 /100 | #323 | Tragic 56.5% |
| Immigrants | El Salvador | 0.0 /100 | #324 | Tragic 56.4% |
| Immigrants | Latin America | 0.0 /100 | #325 | Tragic 56.3% |
| Navajo | 0.0 /100 | #326 | Tragic 56.3% |
| Immigrants | Guatemala | 0.0 /100 | #327 | Tragic 56.2% |
| Cape Verdeans | 0.0 /100 | #328 | Tragic 56.0% |
| Immigrants | Cuba | 0.0 /100 | #329 | Tragic 55.7% |
| Mexicans | 0.0 /100 | #330 | Tragic 55.6% |
| Dominicans | 0.0 /100 | #331 | Tragic 55.5% |
| Immigrants | Yemen | 0.0 /100 | #332 | Tragic 55.3% |
| Yuman | 0.0 /100 | #333 | Tragic 55.1% |
| Immigrants | Azores | 0.0 /100 | #334 | Tragic 54.7% |
| Inupiat | 0.0 /100 | #335 | Tragic 54.6% |
| Pennsylvania Germans | 0.0 /100 | #336 | Tragic 54.5% |