Immigrants from Serbia vs Immigrants from Africa College, Under 1 year
COMPARE
Immigrants from Serbia
Immigrants from Africa
College, Under 1 year
College, Under 1 year Comparison
Immigrants from Serbia
Immigrants from Africa
69.3%
COLLEGE, UNDER 1 YEAR
99.5/ 100
METRIC RATING
59th/ 347
METRIC RANK
65.3%
COLLEGE, UNDER 1 YEAR
44.7/ 100
METRIC RATING
182nd/ 347
METRIC RANK
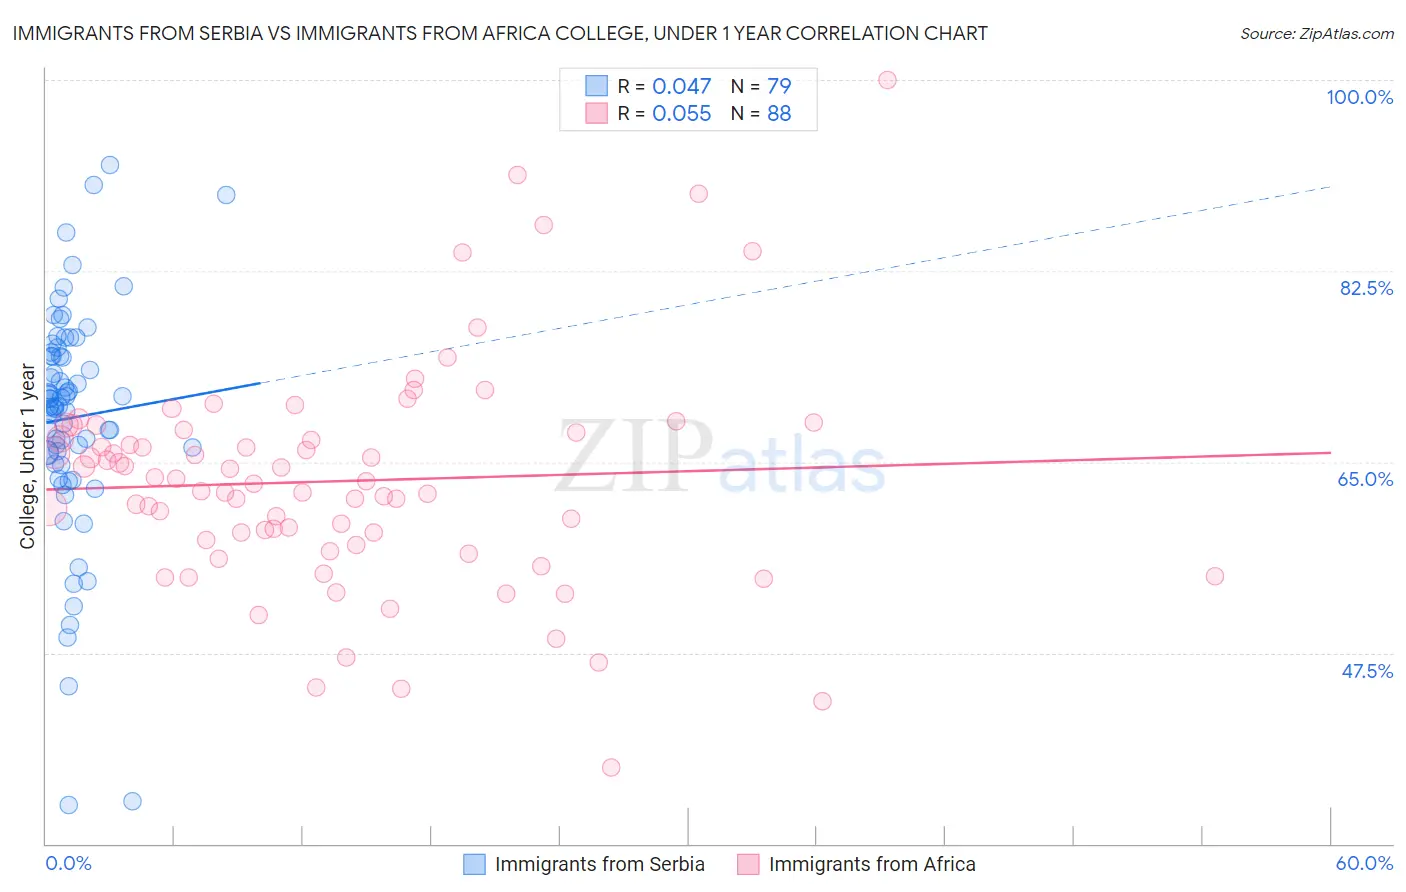
Immigrants from Serbia vs Immigrants from Africa College, Under 1 year Correlation Chart
The statistical analysis conducted on geographies consisting of 131,742,571 people shows no correlation between the proportion of Immigrants from Serbia and percentage of population with at least college, under 1 year education in the United States with a correlation coefficient (R) of 0.047 and weighted average of 69.3%. Similarly, the statistical analysis conducted on geographies consisting of 469,444,786 people shows a slight positive correlation between the proportion of Immigrants from Africa and percentage of population with at least college, under 1 year education in the United States with a correlation coefficient (R) of 0.055 and weighted average of 65.3%, a difference of 6.1%.
College, Under 1 year Correlation Summary
| Measurement | Immigrants from Serbia | Immigrants from Africa |
| Minimum | 33.6% | 37.0% |
| Maximum | 92.2% | 100.0% |
| Range | 58.6% | 63.0% |
| Mean | 69.0% | 63.2% |
| Median | 70.1% | 63.1% |
| Interquartile 25% (IQ1) | 65.8% | 57.7% |
| Interquartile 75% (IQ3) | 74.7% | 67.9% |
| Interquartile Range (IQR) | 8.9% | 10.2% |
| Standard Deviation (Sample) | 10.5% | 10.4% |
| Standard Deviation (Population) | 10.4% | 10.3% |
Similar Demographics by College, Under 1 year
Demographics Similar to Immigrants from Serbia by College, Under 1 year
In terms of college, under 1 year, the demographic groups most similar to Immigrants from Serbia are Immigrants from Asia (69.2%, a difference of 0.090%), Immigrants from Malaysia (69.3%, a difference of 0.13%), Immigrants from Kazakhstan (69.2%, a difference of 0.13%), Immigrants from Belarus (69.2%, a difference of 0.13%), and Asian (69.4%, a difference of 0.23%).
| Demographics | Rating | Rank | College, Under 1 year |
| Immigrants | Russia | 99.8 /100 | #52 | Exceptional 69.9% |
| South Africans | 99.7 /100 | #53 | Exceptional 69.7% |
| Immigrants | Czechoslovakia | 99.7 /100 | #54 | Exceptional 69.6% |
| Maltese | 99.7 /100 | #55 | Exceptional 69.5% |
| Immigrants | Scotland | 99.6 /100 | #56 | Exceptional 69.4% |
| Asians | 99.6 /100 | #57 | Exceptional 69.4% |
| Immigrants | Malaysia | 99.6 /100 | #58 | Exceptional 69.3% |
| Immigrants | Serbia | 99.5 /100 | #59 | Exceptional 69.3% |
| Immigrants | Asia | 99.5 /100 | #60 | Exceptional 69.2% |
| Immigrants | Kazakhstan | 99.5 /100 | #61 | Exceptional 69.2% |
| Immigrants | Belarus | 99.5 /100 | #62 | Exceptional 69.2% |
| Immigrants | Canada | 99.4 /100 | #63 | Exceptional 69.1% |
| Northern Europeans | 99.4 /100 | #64 | Exceptional 69.0% |
| Immigrants | Moldova | 99.3 /100 | #65 | Exceptional 69.0% |
| Immigrants | North America | 99.3 /100 | #66 | Exceptional 69.0% |
Demographics Similar to Immigrants from Africa by College, Under 1 year
In terms of college, under 1 year, the demographic groups most similar to Immigrants from Africa are Spaniard (65.3%, a difference of 0.040%), Dutch (65.3%, a difference of 0.060%), Immigrants from Poland (65.2%, a difference of 0.10%), Bermudan (65.2%, a difference of 0.12%), and Sri Lankan (65.2%, a difference of 0.13%).
| Demographics | Rating | Rank | College, Under 1 year |
| Scotch-Irish | 49.5 /100 | #175 | Average 65.4% |
| French | 48.9 /100 | #176 | Average 65.4% |
| Immigrants | North Macedonia | 48.6 /100 | #177 | Average 65.4% |
| German Russians | 48.3 /100 | #178 | Average 65.4% |
| Guamanians/Chamorros | 48.2 /100 | #179 | Average 65.4% |
| Dutch | 46.1 /100 | #180 | Average 65.3% |
| Spaniards | 45.5 /100 | #181 | Average 65.3% |
| Immigrants | Africa | 44.7 /100 | #182 | Average 65.3% |
| Immigrants | Poland | 42.6 /100 | #183 | Average 65.2% |
| Bermudans | 42.0 /100 | #184 | Average 65.2% |
| Sri Lankans | 41.7 /100 | #185 | Average 65.2% |
| Immigrants | Sierra Leone | 39.7 /100 | #186 | Fair 65.1% |
| Immigrants | Southern Europe | 34.3 /100 | #187 | Fair 64.9% |
| Immigrants | Albania | 32.0 /100 | #188 | Fair 64.9% |
| Spanish | 31.6 /100 | #189 | Fair 64.9% |