Chilean vs Immigrants from Cuba College, Under 1 year
COMPARE
Chilean
Immigrants from Cuba
College, Under 1 year
College, Under 1 year Comparison
Chileans
Immigrants from Cuba
67.6%
COLLEGE, UNDER 1 YEAR
95.3/ 100
METRIC RATING
114th/ 347
METRIC RANK
55.7%
COLLEGE, UNDER 1 YEAR
0.0/ 100
METRIC RATING
329th/ 347
METRIC RANK
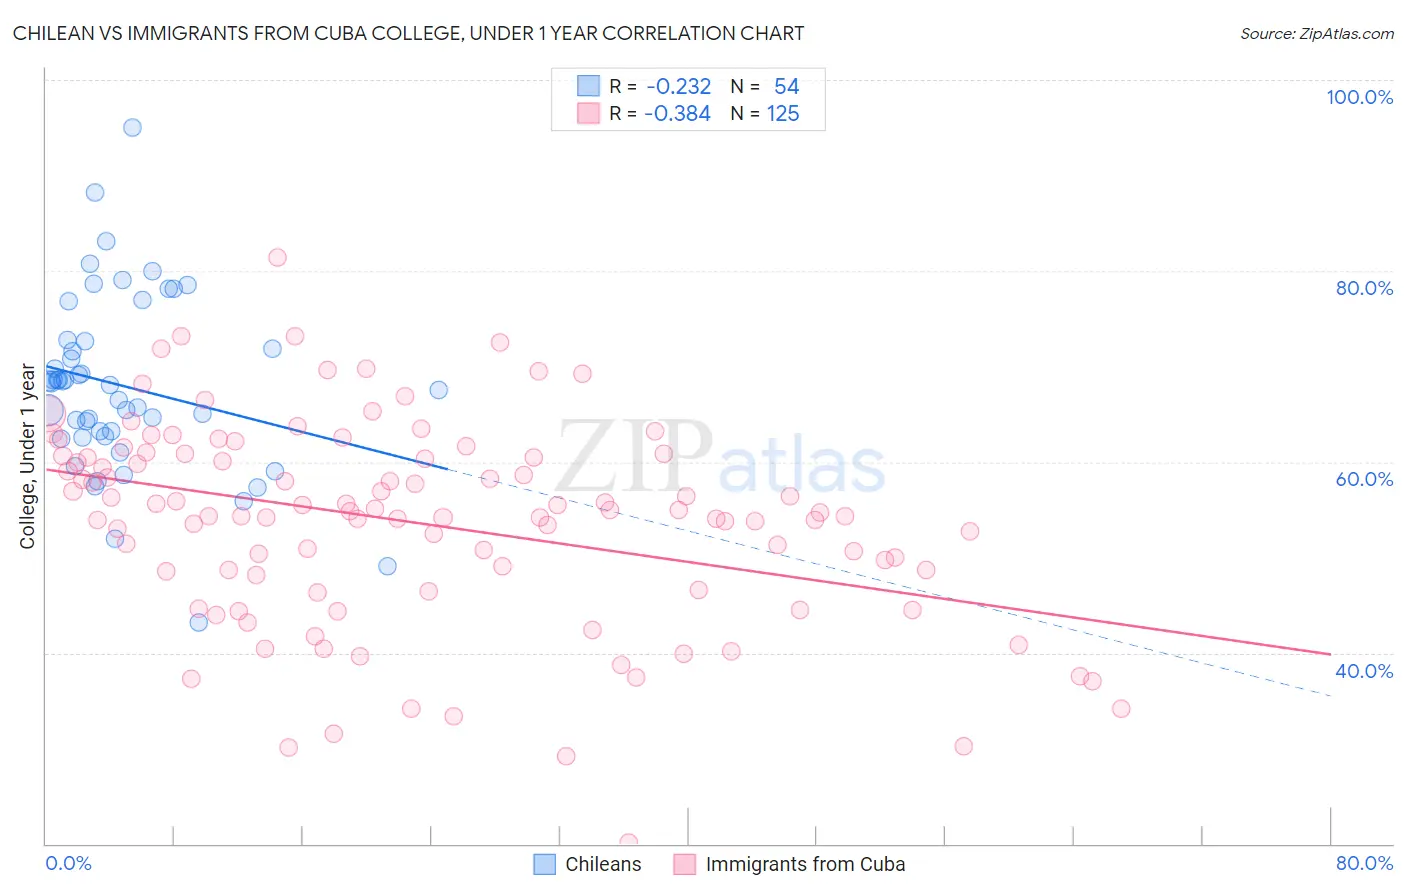
Chilean vs Immigrants from Cuba College, Under 1 year Correlation Chart
The statistical analysis conducted on geographies consisting of 256,681,764 people shows a weak negative correlation between the proportion of Chileans and percentage of population with at least college, under 1 year education in the United States with a correlation coefficient (R) of -0.232 and weighted average of 67.6%. Similarly, the statistical analysis conducted on geographies consisting of 326,030,333 people shows a mild negative correlation between the proportion of Immigrants from Cuba and percentage of population with at least college, under 1 year education in the United States with a correlation coefficient (R) of -0.384 and weighted average of 55.7%, a difference of 21.3%.
College, Under 1 year Correlation Summary
| Measurement | Chilean | Immigrants from Cuba |
| Minimum | 43.2% | 20.1% |
| Maximum | 95.0% | 81.5% |
| Range | 51.9% | 61.4% |
| Mean | 67.9% | 53.6% |
| Median | 68.2% | 54.6% |
| Interquartile 25% (IQ1) | 62.7% | 47.4% |
| Interquartile 75% (IQ3) | 72.6% | 60.6% |
| Interquartile Range (IQR) | 10.0% | 13.2% |
| Standard Deviation (Sample) | 9.4% | 10.6% |
| Standard Deviation (Population) | 9.3% | 10.6% |
Similar Demographics by College, Under 1 year
Demographics Similar to Chileans by College, Under 1 year
In terms of college, under 1 year, the demographic groups most similar to Chileans are Basque (67.6%, a difference of 0.010%), Syrian (67.6%, a difference of 0.080%), Immigrants from Nepal (67.5%, a difference of 0.090%), Macedonian (67.6%, a difference of 0.10%), and Pakistani (67.5%, a difference of 0.11%).
| Demographics | Rating | Rank | College, Under 1 year |
| Austrians | 96.4 /100 | #107 | Exceptional 67.8% |
| Immigrants | Egypt | 96.0 /100 | #108 | Exceptional 67.7% |
| Scandinavians | 95.8 /100 | #109 | Exceptional 67.7% |
| Assyrians/Chaldeans/Syriacs | 95.8 /100 | #110 | Exceptional 67.7% |
| Ukrainians | 95.8 /100 | #111 | Exceptional 67.7% |
| Macedonians | 95.7 /100 | #112 | Exceptional 67.6% |
| Syrians | 95.6 /100 | #113 | Exceptional 67.6% |
| Chileans | 95.3 /100 | #114 | Exceptional 67.6% |
| Basques | 95.2 /100 | #115 | Exceptional 67.6% |
| Immigrants | Nepal | 94.9 /100 | #116 | Exceptional 67.5% |
| Pakistanis | 94.8 /100 | #117 | Exceptional 67.5% |
| Immigrants | Ukraine | 94.7 /100 | #118 | Exceptional 67.5% |
| Lebanese | 94.6 /100 | #119 | Exceptional 67.5% |
| Serbians | 93.9 /100 | #120 | Exceptional 67.4% |
| Slovenes | 93.3 /100 | #121 | Exceptional 67.3% |
Demographics Similar to Immigrants from Cuba by College, Under 1 year
In terms of college, under 1 year, the demographic groups most similar to Immigrants from Cuba are Mexican (55.6%, a difference of 0.13%), Dominican (55.5%, a difference of 0.40%), Cape Verdean (56.0%, a difference of 0.62%), Immigrants from Yemen (55.3%, a difference of 0.80%), and Immigrants from Guatemala (56.2%, a difference of 0.91%).
| Demographics | Rating | Rank | College, Under 1 year |
| Immigrants | Caribbean | 0.0 /100 | #322 | Tragic 56.6% |
| Immigrants | Honduras | 0.0 /100 | #323 | Tragic 56.5% |
| Immigrants | El Salvador | 0.0 /100 | #324 | Tragic 56.4% |
| Immigrants | Latin America | 0.0 /100 | #325 | Tragic 56.3% |
| Navajo | 0.0 /100 | #326 | Tragic 56.3% |
| Immigrants | Guatemala | 0.0 /100 | #327 | Tragic 56.2% |
| Cape Verdeans | 0.0 /100 | #328 | Tragic 56.0% |
| Immigrants | Cuba | 0.0 /100 | #329 | Tragic 55.7% |
| Mexicans | 0.0 /100 | #330 | Tragic 55.6% |
| Dominicans | 0.0 /100 | #331 | Tragic 55.5% |
| Immigrants | Yemen | 0.0 /100 | #332 | Tragic 55.3% |
| Yuman | 0.0 /100 | #333 | Tragic 55.1% |
| Immigrants | Azores | 0.0 /100 | #334 | Tragic 54.7% |
| Inupiat | 0.0 /100 | #335 | Tragic 54.6% |
| Pennsylvania Germans | 0.0 /100 | #336 | Tragic 54.5% |