Australian vs Immigrants from Cuba College, Under 1 year
COMPARE
Australian
Immigrants from Cuba
College, Under 1 year
College, Under 1 year Comparison
Australians
Immigrants from Cuba
70.4%
COLLEGE, UNDER 1 YEAR
99.9/ 100
METRIC RATING
38th/ 347
METRIC RANK
55.7%
COLLEGE, UNDER 1 YEAR
0.0/ 100
METRIC RATING
329th/ 347
METRIC RANK
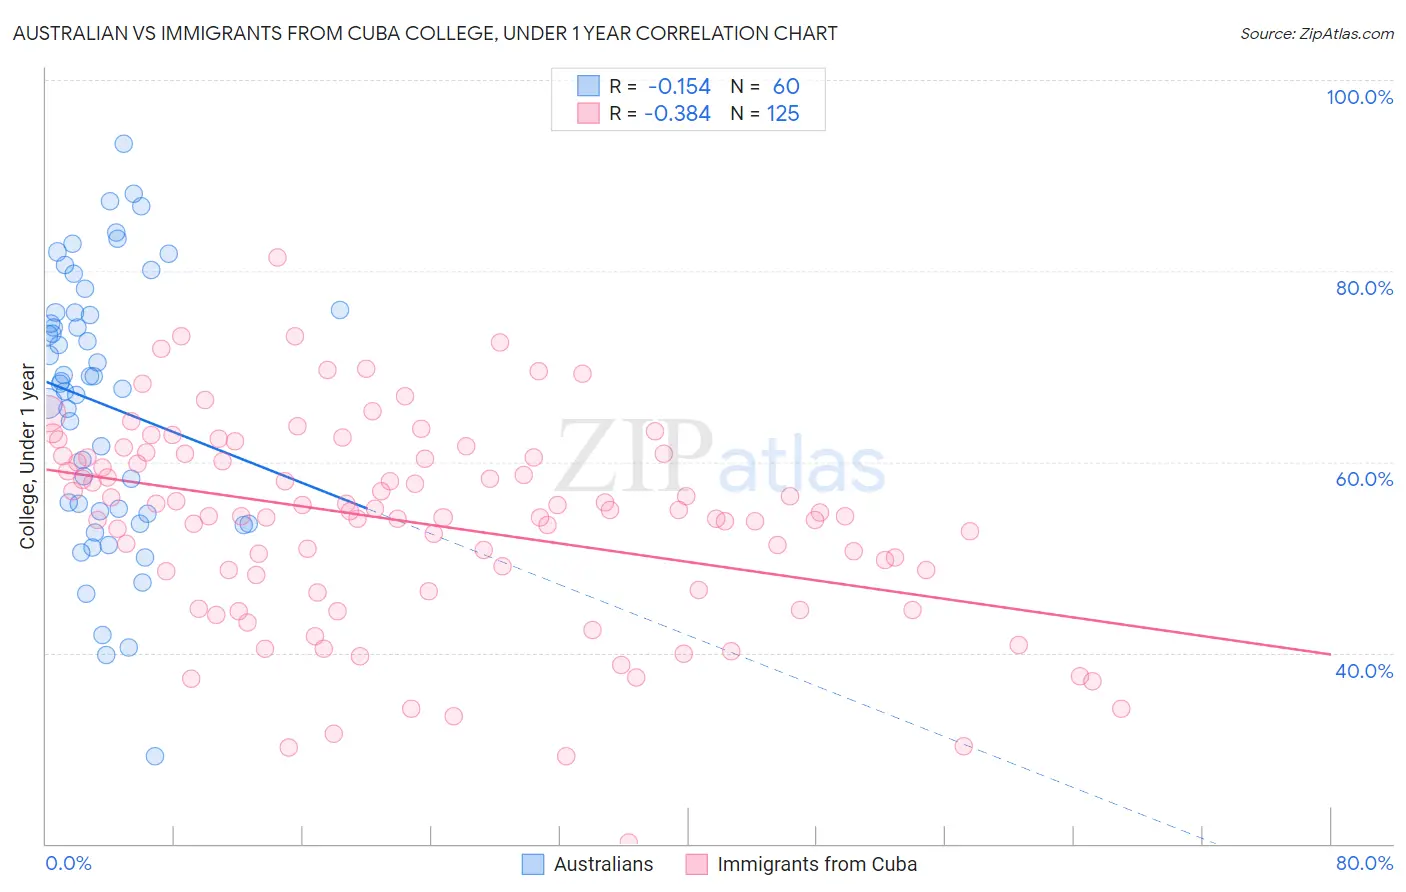
Australian vs Immigrants from Cuba College, Under 1 year Correlation Chart
The statistical analysis conducted on geographies consisting of 224,162,526 people shows a poor negative correlation between the proportion of Australians and percentage of population with at least college, under 1 year education in the United States with a correlation coefficient (R) of -0.154 and weighted average of 70.4%. Similarly, the statistical analysis conducted on geographies consisting of 326,030,333 people shows a mild negative correlation between the proportion of Immigrants from Cuba and percentage of population with at least college, under 1 year education in the United States with a correlation coefficient (R) of -0.384 and weighted average of 55.7%, a difference of 26.3%.
College, Under 1 year Correlation Summary
| Measurement | Australian | Immigrants from Cuba |
| Minimum | 29.1% | 20.1% |
| Maximum | 93.4% | 81.5% |
| Range | 64.2% | 61.4% |
| Mean | 66.0% | 53.6% |
| Median | 68.3% | 54.6% |
| Interquartile 25% (IQ1) | 54.7% | 47.4% |
| Interquartile 75% (IQ3) | 75.6% | 60.6% |
| Interquartile Range (IQR) | 21.0% | 13.2% |
| Standard Deviation (Sample) | 14.0% | 10.6% |
| Standard Deviation (Population) | 13.8% | 10.6% |
Similar Demographics by College, Under 1 year
Demographics Similar to Australians by College, Under 1 year
In terms of college, under 1 year, the demographic groups most similar to Australians are Bhutanese (70.3%, a difference of 0.020%), Immigrants from Turkey (70.3%, a difference of 0.030%), Immigrants from Saudi Arabia (70.4%, a difference of 0.070%), Immigrants from Kuwait (70.3%, a difference of 0.070%), and Immigrants from Lithuania (70.3%, a difference of 0.11%).
| Demographics | Rating | Rank | College, Under 1 year |
| Indians (Asian) | 99.9 /100 | #31 | Exceptional 70.8% |
| Turks | 99.9 /100 | #32 | Exceptional 70.7% |
| Immigrants | South Africa | 99.9 /100 | #33 | Exceptional 70.6% |
| Estonians | 99.9 /100 | #34 | Exceptional 70.6% |
| Russians | 99.9 /100 | #35 | Exceptional 70.5% |
| Immigrants | Sri Lanka | 99.9 /100 | #36 | Exceptional 70.5% |
| Immigrants | Saudi Arabia | 99.9 /100 | #37 | Exceptional 70.4% |
| Australians | 99.9 /100 | #38 | Exceptional 70.4% |
| Bhutanese | 99.9 /100 | #39 | Exceptional 70.3% |
| Immigrants | Turkey | 99.9 /100 | #40 | Exceptional 70.3% |
| Immigrants | Kuwait | 99.9 /100 | #41 | Exceptional 70.3% |
| Immigrants | Lithuania | 99.9 /100 | #42 | Exceptional 70.3% |
| Israelis | 99.9 /100 | #43 | Exceptional 70.2% |
| New Zealanders | 99.9 /100 | #44 | Exceptional 70.2% |
| Immigrants | Norway | 99.9 /100 | #45 | Exceptional 70.2% |
Demographics Similar to Immigrants from Cuba by College, Under 1 year
In terms of college, under 1 year, the demographic groups most similar to Immigrants from Cuba are Mexican (55.6%, a difference of 0.13%), Dominican (55.5%, a difference of 0.40%), Cape Verdean (56.0%, a difference of 0.62%), Immigrants from Yemen (55.3%, a difference of 0.80%), and Immigrants from Guatemala (56.2%, a difference of 0.91%).
| Demographics | Rating | Rank | College, Under 1 year |
| Immigrants | Caribbean | 0.0 /100 | #322 | Tragic 56.6% |
| Immigrants | Honduras | 0.0 /100 | #323 | Tragic 56.5% |
| Immigrants | El Salvador | 0.0 /100 | #324 | Tragic 56.4% |
| Immigrants | Latin America | 0.0 /100 | #325 | Tragic 56.3% |
| Navajo | 0.0 /100 | #326 | Tragic 56.3% |
| Immigrants | Guatemala | 0.0 /100 | #327 | Tragic 56.2% |
| Cape Verdeans | 0.0 /100 | #328 | Tragic 56.0% |
| Immigrants | Cuba | 0.0 /100 | #329 | Tragic 55.7% |
| Mexicans | 0.0 /100 | #330 | Tragic 55.6% |
| Dominicans | 0.0 /100 | #331 | Tragic 55.5% |
| Immigrants | Yemen | 0.0 /100 | #332 | Tragic 55.3% |
| Yuman | 0.0 /100 | #333 | Tragic 55.1% |
| Immigrants | Azores | 0.0 /100 | #334 | Tragic 54.7% |
| Inupiat | 0.0 /100 | #335 | Tragic 54.6% |
| Pennsylvania Germans | 0.0 /100 | #336 | Tragic 54.5% |