Immigrants from Scotland vs Immigrants from Northern Europe College, 1 year or more
COMPARE
Immigrants from Scotland
Immigrants from Northern Europe
College, 1 year or more
College, 1 year or more Comparison
Immigrants from Scotland
Immigrants from Northern Europe
63.4%
COLLEGE, 1 YEAR OR MORE
99.4/ 100
METRIC RATING
63rd/ 347
METRIC RANK
65.6%
COLLEGE, 1 YEAR OR MORE
100.0/ 100
METRIC RATING
29th/ 347
METRIC RANK
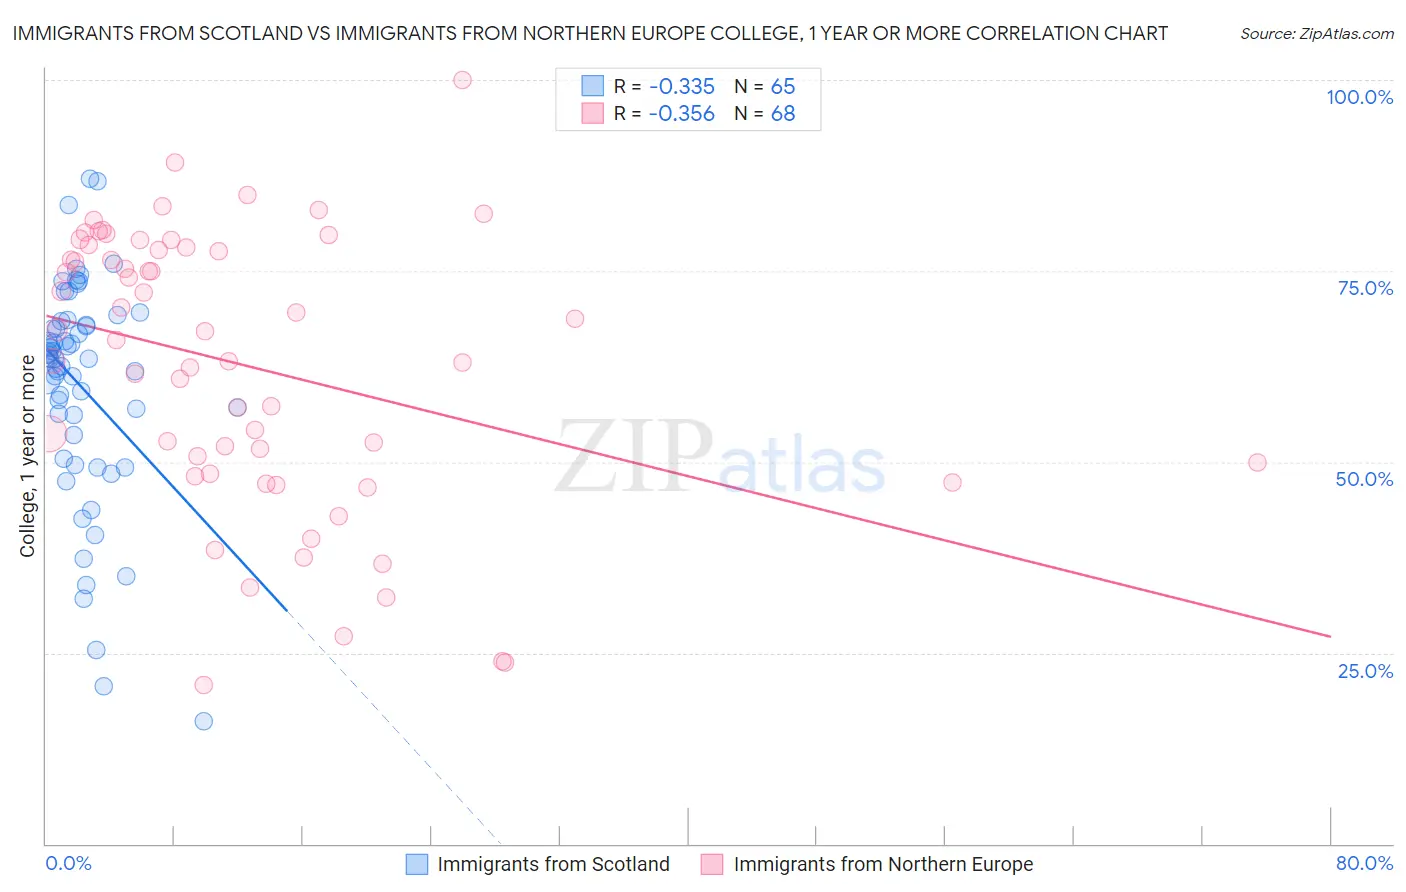
Immigrants from Scotland vs Immigrants from Northern Europe College, 1 year or more Correlation Chart
The statistical analysis conducted on geographies consisting of 196,397,263 people shows a mild negative correlation between the proportion of Immigrants from Scotland and percentage of population with at least college, 1 year or more education in the United States with a correlation coefficient (R) of -0.335 and weighted average of 63.4%. Similarly, the statistical analysis conducted on geographies consisting of 477,221,622 people shows a mild negative correlation between the proportion of Immigrants from Northern Europe and percentage of population with at least college, 1 year or more education in the United States with a correlation coefficient (R) of -0.356 and weighted average of 65.6%, a difference of 3.5%.
College, 1 year or more Correlation Summary
| Measurement | Immigrants from Scotland | Immigrants from Northern Europe |
| Minimum | 16.1% | 20.8% |
| Maximum | 87.1% | 100.0% |
| Range | 71.0% | 79.2% |
| Mean | 59.8% | 62.6% |
| Median | 63.6% | 66.5% |
| Interquartile 25% (IQ1) | 51.9% | 49.2% |
| Interquartile 75% (IQ3) | 68.2% | 77.9% |
| Interquartile Range (IQR) | 16.3% | 28.7% |
| Standard Deviation (Sample) | 14.6% | 18.2% |
| Standard Deviation (Population) | 14.5% | 18.0% |
Similar Demographics by College, 1 year or more
Demographics Similar to Immigrants from Scotland by College, 1 year or more
In terms of college, 1 year or more, the demographic groups most similar to Immigrants from Scotland are Immigrants from Spain (63.4%, a difference of 0.030%), Immigrants from Indonesia (63.5%, a difference of 0.13%), Maltese (63.4%, a difference of 0.13%), Bolivian (63.5%, a difference of 0.14%), and Immigrants from Europe (63.3%, a difference of 0.24%).
| Demographics | Rating | Rank | College, 1 year or more |
| Immigrants | Czechoslovakia | 99.7 /100 | #56 | Exceptional 64.1% |
| South Africans | 99.7 /100 | #57 | Exceptional 64.1% |
| Immigrants | Asia | 99.7 /100 | #58 | Exceptional 64.0% |
| Immigrants | Serbia | 99.6 /100 | #59 | Exceptional 63.8% |
| Immigrants | Kazakhstan | 99.5 /100 | #60 | Exceptional 63.6% |
| Bolivians | 99.5 /100 | #61 | Exceptional 63.5% |
| Immigrants | Indonesia | 99.5 /100 | #62 | Exceptional 63.5% |
| Immigrants | Scotland | 99.4 /100 | #63 | Exceptional 63.4% |
| Immigrants | Spain | 99.4 /100 | #64 | Exceptional 63.4% |
| Maltese | 99.3 /100 | #65 | Exceptional 63.4% |
| Immigrants | Europe | 99.3 /100 | #66 | Exceptional 63.3% |
| Immigrants | Romania | 99.3 /100 | #67 | Exceptional 63.3% |
| Immigrants | Greece | 99.3 /100 | #68 | Exceptional 63.3% |
| Immigrants | Zimbabwe | 99.3 /100 | #69 | Exceptional 63.3% |
| Argentineans | 99.2 /100 | #70 | Exceptional 63.2% |
Demographics Similar to Immigrants from Northern Europe by College, 1 year or more
In terms of college, 1 year or more, the demographic groups most similar to Immigrants from Northern Europe are Immigrants from Denmark (65.6%, a difference of 0.11%), Turkish (65.5%, a difference of 0.19%), Bulgarian (65.5%, a difference of 0.24%), Immigrants from France (65.8%, a difference of 0.25%), and Immigrants from Sri Lanka (65.4%, a difference of 0.39%).
| Demographics | Rating | Rank | College, 1 year or more |
| Soviet Union | 100.0 /100 | #22 | Exceptional 66.4% |
| Immigrants | China | 100.0 /100 | #23 | Exceptional 66.4% |
| Immigrants | Belgium | 100.0 /100 | #24 | Exceptional 66.3% |
| Indians (Asian) | 100.0 /100 | #25 | Exceptional 66.1% |
| Latvians | 100.0 /100 | #26 | Exceptional 66.1% |
| Immigrants | Ireland | 100.0 /100 | #27 | Exceptional 65.9% |
| Immigrants | France | 100.0 /100 | #28 | Exceptional 65.8% |
| Immigrants | Northern Europe | 100.0 /100 | #29 | Exceptional 65.6% |
| Immigrants | Denmark | 100.0 /100 | #30 | Exceptional 65.6% |
| Turks | 100.0 /100 | #31 | Exceptional 65.5% |
| Bulgarians | 100.0 /100 | #32 | Exceptional 65.5% |
| Immigrants | Sri Lanka | 99.9 /100 | #33 | Exceptional 65.4% |
| Israelis | 99.9 /100 | #34 | Exceptional 65.3% |
| Immigrants | Turkey | 99.9 /100 | #35 | Exceptional 65.2% |
| Immigrants | South Africa | 99.9 /100 | #36 | Exceptional 65.1% |