Immigrants from Scotland vs Cypriot College, 1 year or more
COMPARE
Immigrants from Scotland
Cypriot
College, 1 year or more
College, 1 year or more Comparison
Immigrants from Scotland
Cypriots
63.4%
COLLEGE, 1 YEAR OR MORE
99.4/ 100
METRIC RATING
63rd/ 347
METRIC RANK
67.0%
COLLEGE, 1 YEAR OR MORE
100.0/ 100
METRIC RATING
12th/ 347
METRIC RANK
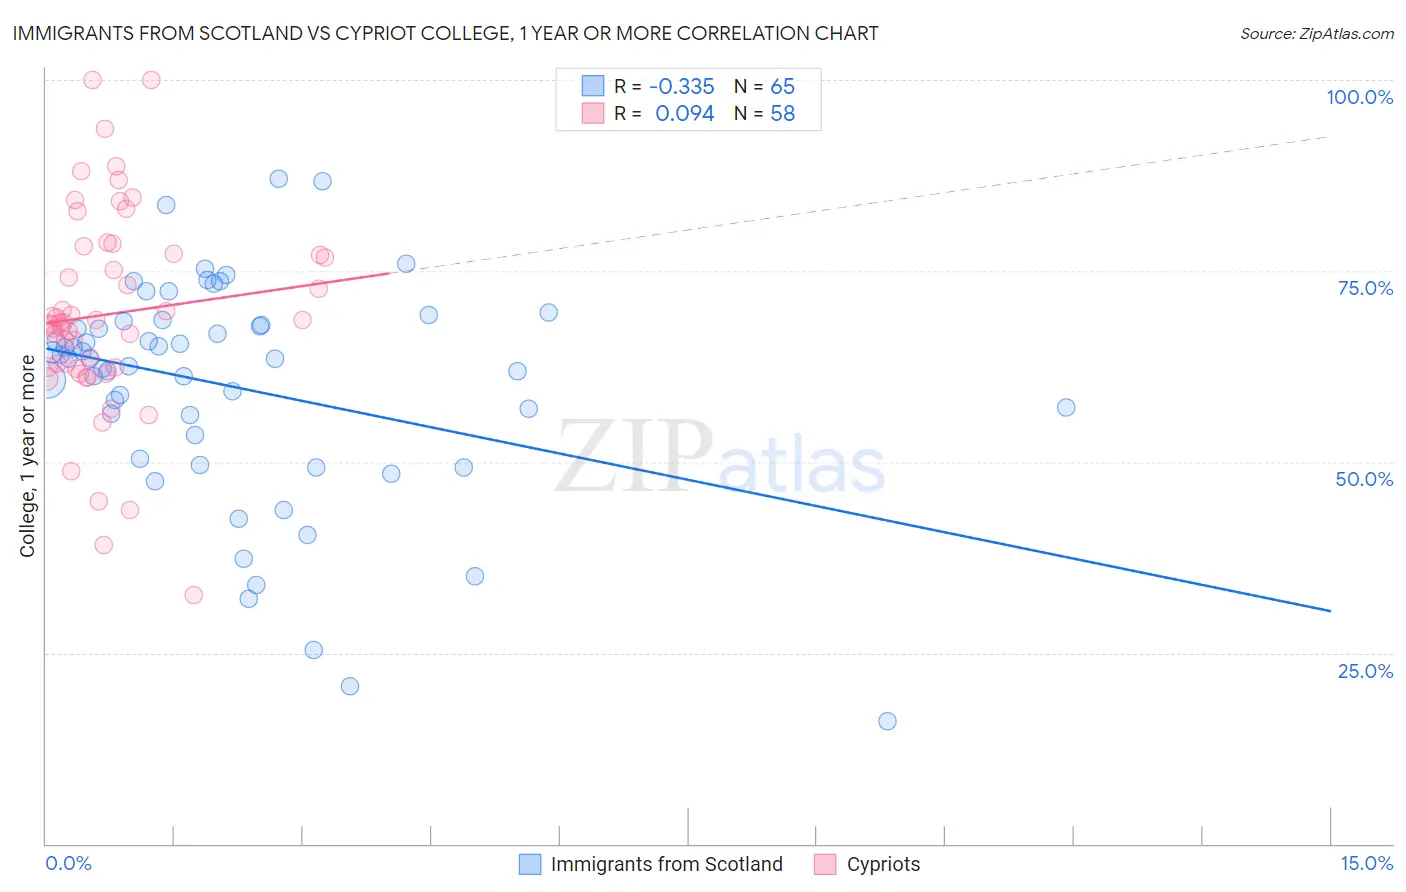
Immigrants from Scotland vs Cypriot College, 1 year or more Correlation Chart
The statistical analysis conducted on geographies consisting of 196,397,263 people shows a mild negative correlation between the proportion of Immigrants from Scotland and percentage of population with at least college, 1 year or more education in the United States with a correlation coefficient (R) of -0.335 and weighted average of 63.4%. Similarly, the statistical analysis conducted on geographies consisting of 61,870,752 people shows a slight positive correlation between the proportion of Cypriots and percentage of population with at least college, 1 year or more education in the United States with a correlation coefficient (R) of 0.094 and weighted average of 67.0%, a difference of 5.7%.
College, 1 year or more Correlation Summary
| Measurement | Immigrants from Scotland | Cypriot |
| Minimum | 16.1% | 32.6% |
| Maximum | 87.1% | 100.0% |
| Range | 71.0% | 67.4% |
| Mean | 59.8% | 69.3% |
| Median | 63.6% | 68.2% |
| Interquartile 25% (IQ1) | 51.9% | 62.3% |
| Interquartile 75% (IQ3) | 68.2% | 77.2% |
| Interquartile Range (IQR) | 16.3% | 14.9% |
| Standard Deviation (Sample) | 14.6% | 13.4% |
| Standard Deviation (Population) | 14.5% | 13.3% |
Similar Demographics by College, 1 year or more
Demographics Similar to Immigrants from Scotland by College, 1 year or more
In terms of college, 1 year or more, the demographic groups most similar to Immigrants from Scotland are Immigrants from Spain (63.4%, a difference of 0.030%), Immigrants from Indonesia (63.5%, a difference of 0.13%), Maltese (63.4%, a difference of 0.13%), Bolivian (63.5%, a difference of 0.14%), and Immigrants from Europe (63.3%, a difference of 0.24%).
| Demographics | Rating | Rank | College, 1 year or more |
| Immigrants | Czechoslovakia | 99.7 /100 | #56 | Exceptional 64.1% |
| South Africans | 99.7 /100 | #57 | Exceptional 64.1% |
| Immigrants | Asia | 99.7 /100 | #58 | Exceptional 64.0% |
| Immigrants | Serbia | 99.6 /100 | #59 | Exceptional 63.8% |
| Immigrants | Kazakhstan | 99.5 /100 | #60 | Exceptional 63.6% |
| Bolivians | 99.5 /100 | #61 | Exceptional 63.5% |
| Immigrants | Indonesia | 99.5 /100 | #62 | Exceptional 63.5% |
| Immigrants | Scotland | 99.4 /100 | #63 | Exceptional 63.4% |
| Immigrants | Spain | 99.4 /100 | #64 | Exceptional 63.4% |
| Maltese | 99.3 /100 | #65 | Exceptional 63.4% |
| Immigrants | Europe | 99.3 /100 | #66 | Exceptional 63.3% |
| Immigrants | Romania | 99.3 /100 | #67 | Exceptional 63.3% |
| Immigrants | Greece | 99.3 /100 | #68 | Exceptional 63.3% |
| Immigrants | Zimbabwe | 99.3 /100 | #69 | Exceptional 63.3% |
| Argentineans | 99.2 /100 | #70 | Exceptional 63.2% |
Demographics Similar to Cypriots by College, 1 year or more
In terms of college, 1 year or more, the demographic groups most similar to Cypriots are Immigrants from South Central Asia (67.1%, a difference of 0.17%), Immigrants from Sweden (66.8%, a difference of 0.31%), Burmese (66.7%, a difference of 0.50%), Cambodian (66.7%, a difference of 0.50%), and Immigrants from Japan (66.7%, a difference of 0.54%).
| Demographics | Rating | Rank | College, 1 year or more |
| Immigrants | India | 100.0 /100 | #5 | Exceptional 69.6% |
| Immigrants | Iran | 100.0 /100 | #6 | Exceptional 69.5% |
| Okinawans | 100.0 /100 | #7 | Exceptional 69.0% |
| Thais | 100.0 /100 | #8 | Exceptional 68.6% |
| Immigrants | Israel | 100.0 /100 | #9 | Exceptional 67.8% |
| Immigrants | Australia | 100.0 /100 | #10 | Exceptional 67.7% |
| Immigrants | South Central Asia | 100.0 /100 | #11 | Exceptional 67.1% |
| Cypriots | 100.0 /100 | #12 | Exceptional 67.0% |
| Immigrants | Sweden | 100.0 /100 | #13 | Exceptional 66.8% |
| Burmese | 100.0 /100 | #14 | Exceptional 66.7% |
| Cambodians | 100.0 /100 | #15 | Exceptional 66.7% |
| Immigrants | Japan | 100.0 /100 | #16 | Exceptional 66.7% |
| Immigrants | Eastern Asia | 100.0 /100 | #17 | Exceptional 66.6% |
| Eastern Europeans | 100.0 /100 | #18 | Exceptional 66.6% |
| Immigrants | Switzerland | 100.0 /100 | #19 | Exceptional 66.5% |