Immigrants from Scotland vs Taiwanese College, 1 year or more
COMPARE
Immigrants from Scotland
Taiwanese
College, 1 year or more
College, 1 year or more Comparison
Immigrants from Scotland
Taiwanese
63.4%
COLLEGE, 1 YEAR OR MORE
99.4/ 100
METRIC RATING
63rd/ 347
METRIC RANK
60.7%
COLLEGE, 1 YEAR OR MORE
84.3/ 100
METRIC RATING
138th/ 347
METRIC RANK
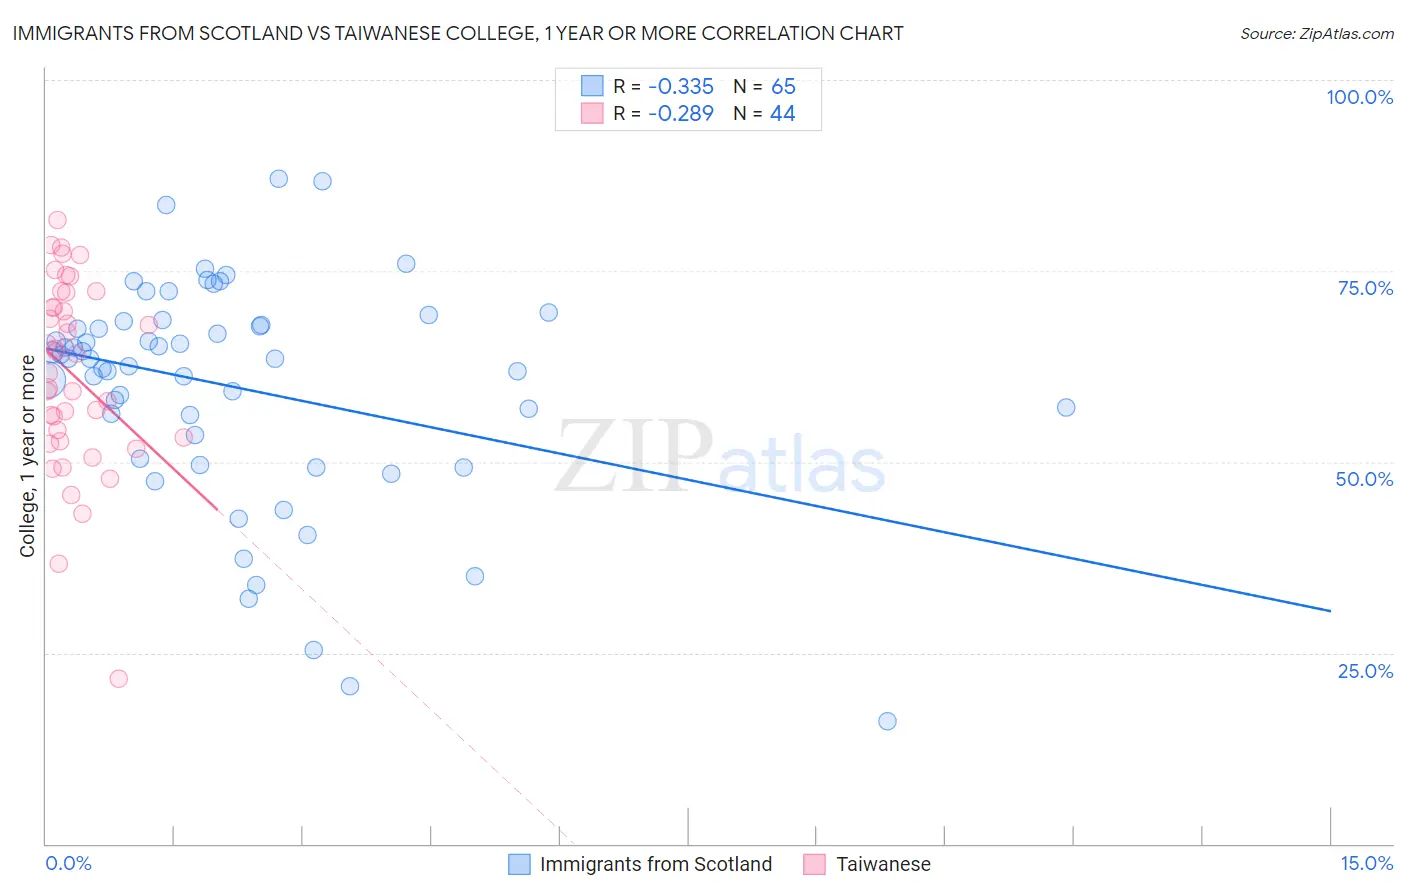
Immigrants from Scotland vs Taiwanese College, 1 year or more Correlation Chart
The statistical analysis conducted on geographies consisting of 196,397,263 people shows a mild negative correlation between the proportion of Immigrants from Scotland and percentage of population with at least college, 1 year or more education in the United States with a correlation coefficient (R) of -0.335 and weighted average of 63.4%. Similarly, the statistical analysis conducted on geographies consisting of 31,724,936 people shows a weak negative correlation between the proportion of Taiwanese and percentage of population with at least college, 1 year or more education in the United States with a correlation coefficient (R) of -0.289 and weighted average of 60.7%, a difference of 4.4%.
College, 1 year or more Correlation Summary
| Measurement | Immigrants from Scotland | Taiwanese |
| Minimum | 16.1% | 21.6% |
| Maximum | 87.1% | 81.7% |
| Range | 71.0% | 60.1% |
| Mean | 59.8% | 61.5% |
| Median | 63.6% | 62.9% |
| Interquartile 25% (IQ1) | 51.9% | 53.0% |
| Interquartile 75% (IQ3) | 68.2% | 71.2% |
| Interquartile Range (IQR) | 16.3% | 18.2% |
| Standard Deviation (Sample) | 14.6% | 12.5% |
| Standard Deviation (Population) | 14.5% | 12.3% |
Similar Demographics by College, 1 year or more
Demographics Similar to Immigrants from Scotland by College, 1 year or more
In terms of college, 1 year or more, the demographic groups most similar to Immigrants from Scotland are Immigrants from Spain (63.4%, a difference of 0.030%), Immigrants from Indonesia (63.5%, a difference of 0.13%), Maltese (63.4%, a difference of 0.13%), Bolivian (63.5%, a difference of 0.14%), and Immigrants from Europe (63.3%, a difference of 0.24%).
| Demographics | Rating | Rank | College, 1 year or more |
| Immigrants | Czechoslovakia | 99.7 /100 | #56 | Exceptional 64.1% |
| South Africans | 99.7 /100 | #57 | Exceptional 64.1% |
| Immigrants | Asia | 99.7 /100 | #58 | Exceptional 64.0% |
| Immigrants | Serbia | 99.6 /100 | #59 | Exceptional 63.8% |
| Immigrants | Kazakhstan | 99.5 /100 | #60 | Exceptional 63.6% |
| Bolivians | 99.5 /100 | #61 | Exceptional 63.5% |
| Immigrants | Indonesia | 99.5 /100 | #62 | Exceptional 63.5% |
| Immigrants | Scotland | 99.4 /100 | #63 | Exceptional 63.4% |
| Immigrants | Spain | 99.4 /100 | #64 | Exceptional 63.4% |
| Maltese | 99.3 /100 | #65 | Exceptional 63.4% |
| Immigrants | Europe | 99.3 /100 | #66 | Exceptional 63.3% |
| Immigrants | Romania | 99.3 /100 | #67 | Exceptional 63.3% |
| Immigrants | Greece | 99.3 /100 | #68 | Exceptional 63.3% |
| Immigrants | Zimbabwe | 99.3 /100 | #69 | Exceptional 63.3% |
| Argentineans | 99.2 /100 | #70 | Exceptional 63.2% |
Demographics Similar to Taiwanese by College, 1 year or more
In terms of college, 1 year or more, the demographic groups most similar to Taiwanese are Immigrants from Eritrea (60.7%, a difference of 0.0%), Iraqi (60.7%, a difference of 0.10%), Immigrants from Afghanistan (60.7%, a difference of 0.11%), Polish (60.7%, a difference of 0.15%), and Canadian (60.6%, a difference of 0.15%).
| Demographics | Rating | Rank | College, 1 year or more |
| Immigrants | Morocco | 89.5 /100 | #131 | Excellent 61.1% |
| Scandinavians | 88.2 /100 | #132 | Excellent 61.0% |
| Immigrants | Uzbekistan | 88.0 /100 | #133 | Excellent 61.0% |
| Immigrants | Venezuela | 87.9 /100 | #134 | Excellent 61.0% |
| Immigrants | Uganda | 87.4 /100 | #135 | Excellent 60.9% |
| Basques | 87.2 /100 | #136 | Excellent 60.9% |
| Slovenes | 86.5 /100 | #137 | Excellent 60.9% |
| Taiwanese | 84.3 /100 | #138 | Excellent 60.7% |
| Immigrants | Eritrea | 84.3 /100 | #139 | Excellent 60.7% |
| Iraqis | 83.3 /100 | #140 | Excellent 60.7% |
| Immigrants | Afghanistan | 83.1 /100 | #141 | Excellent 60.7% |
| Poles | 82.8 /100 | #142 | Excellent 60.7% |
| Canadians | 82.7 /100 | #143 | Excellent 60.6% |
| Czechs | 81.9 /100 | #144 | Excellent 60.6% |
| Slavs | 81.1 /100 | #145 | Excellent 60.6% |