Immigrants from Scotland vs Immigrants from Cambodia College, 1 year or more
COMPARE
Immigrants from Scotland
Immigrants from Cambodia
College, 1 year or more
College, 1 year or more Comparison
Immigrants from Scotland
Immigrants from Cambodia
63.4%
COLLEGE, 1 YEAR OR MORE
99.4/ 100
METRIC RATING
63rd/ 347
METRIC RANK
55.4%
COLLEGE, 1 YEAR OR MORE
0.6/ 100
METRIC RATING
251st/ 347
METRIC RANK
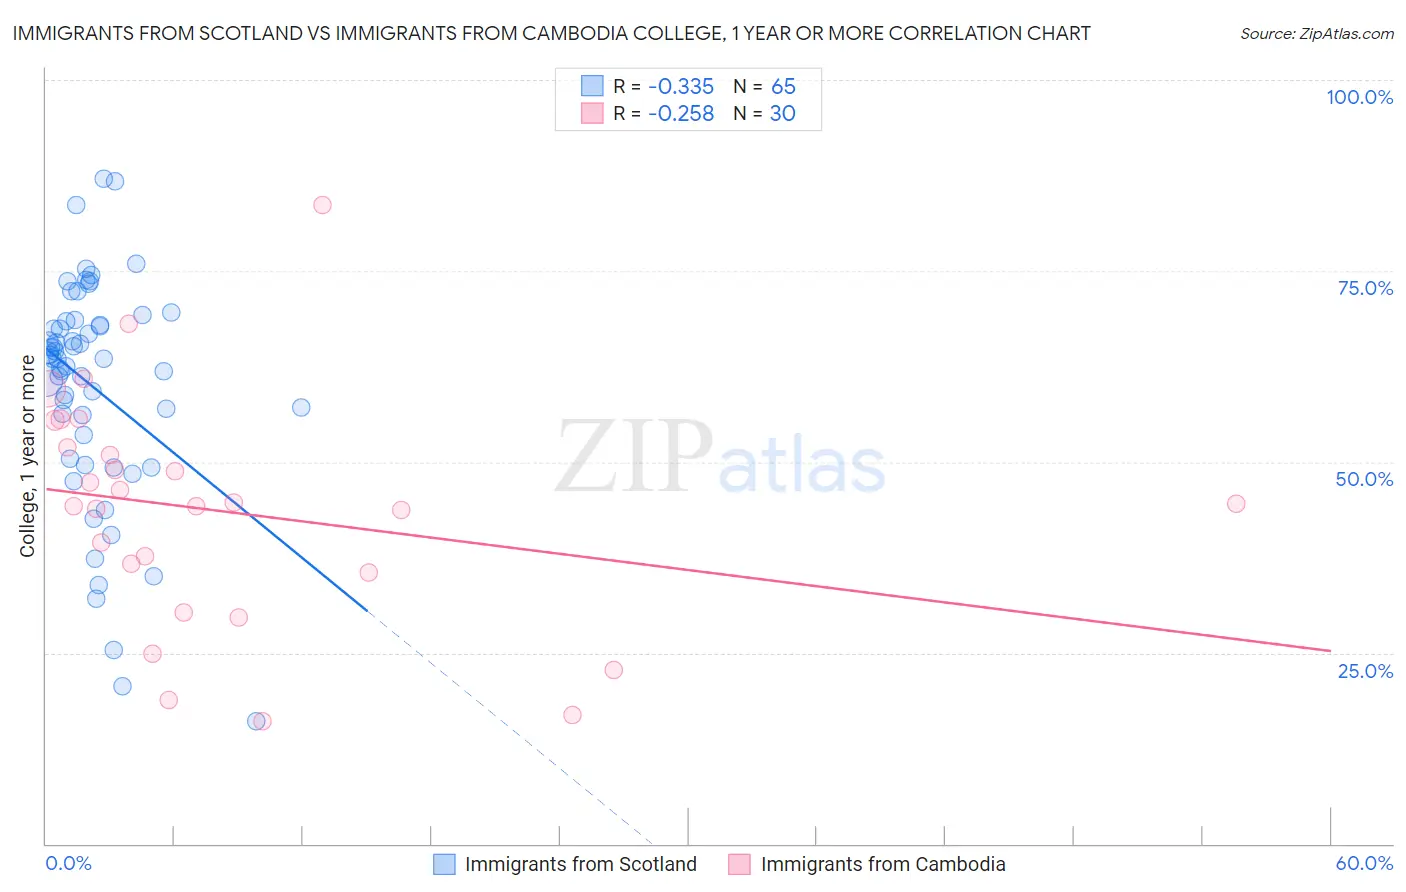
Immigrants from Scotland vs Immigrants from Cambodia College, 1 year or more Correlation Chart
The statistical analysis conducted on geographies consisting of 196,397,263 people shows a mild negative correlation between the proportion of Immigrants from Scotland and percentage of population with at least college, 1 year or more education in the United States with a correlation coefficient (R) of -0.335 and weighted average of 63.4%. Similarly, the statistical analysis conducted on geographies consisting of 205,153,442 people shows a weak negative correlation between the proportion of Immigrants from Cambodia and percentage of population with at least college, 1 year or more education in the United States with a correlation coefficient (R) of -0.258 and weighted average of 55.4%, a difference of 14.4%.
College, 1 year or more Correlation Summary
| Measurement | Immigrants from Scotland | Immigrants from Cambodia |
| Minimum | 16.1% | 16.1% |
| Maximum | 87.1% | 83.7% |
| Range | 71.0% | 67.6% |
| Mean | 59.8% | 43.5% |
| Median | 63.6% | 44.3% |
| Interquartile 25% (IQ1) | 51.9% | 35.5% |
| Interquartile 75% (IQ3) | 68.2% | 51.9% |
| Interquartile Range (IQR) | 16.3% | 16.4% |
| Standard Deviation (Sample) | 14.6% | 15.3% |
| Standard Deviation (Population) | 14.5% | 15.1% |
Similar Demographics by College, 1 year or more
Demographics Similar to Immigrants from Scotland by College, 1 year or more
In terms of college, 1 year or more, the demographic groups most similar to Immigrants from Scotland are Immigrants from Spain (63.4%, a difference of 0.030%), Immigrants from Indonesia (63.5%, a difference of 0.13%), Maltese (63.4%, a difference of 0.13%), Bolivian (63.5%, a difference of 0.14%), and Immigrants from Europe (63.3%, a difference of 0.24%).
| Demographics | Rating | Rank | College, 1 year or more |
| Immigrants | Czechoslovakia | 99.7 /100 | #56 | Exceptional 64.1% |
| South Africans | 99.7 /100 | #57 | Exceptional 64.1% |
| Immigrants | Asia | 99.7 /100 | #58 | Exceptional 64.0% |
| Immigrants | Serbia | 99.6 /100 | #59 | Exceptional 63.8% |
| Immigrants | Kazakhstan | 99.5 /100 | #60 | Exceptional 63.6% |
| Bolivians | 99.5 /100 | #61 | Exceptional 63.5% |
| Immigrants | Indonesia | 99.5 /100 | #62 | Exceptional 63.5% |
| Immigrants | Scotland | 99.4 /100 | #63 | Exceptional 63.4% |
| Immigrants | Spain | 99.4 /100 | #64 | Exceptional 63.4% |
| Maltese | 99.3 /100 | #65 | Exceptional 63.4% |
| Immigrants | Europe | 99.3 /100 | #66 | Exceptional 63.3% |
| Immigrants | Romania | 99.3 /100 | #67 | Exceptional 63.3% |
| Immigrants | Greece | 99.3 /100 | #68 | Exceptional 63.3% |
| Immigrants | Zimbabwe | 99.3 /100 | #69 | Exceptional 63.3% |
| Argentineans | 99.2 /100 | #70 | Exceptional 63.2% |
Demographics Similar to Immigrants from Cambodia by College, 1 year or more
In terms of college, 1 year or more, the demographic groups most similar to Immigrants from Cambodia are Aleut (55.4%, a difference of 0.030%), Delaware (55.5%, a difference of 0.090%), Immigrants from Trinidad and Tobago (55.5%, a difference of 0.11%), Immigrants from Barbados (55.4%, a difference of 0.13%), and Immigrants from Congo (55.6%, a difference of 0.21%).
| Demographics | Rating | Rank | College, 1 year or more |
| Chippewa | 0.9 /100 | #244 | Tragic 55.7% |
| Immigrants | Liberia | 0.8 /100 | #245 | Tragic 55.7% |
| Malaysians | 0.8 /100 | #246 | Tragic 55.6% |
| Hawaiians | 0.8 /100 | #247 | Tragic 55.6% |
| Immigrants | Congo | 0.8 /100 | #248 | Tragic 55.6% |
| Immigrants | Trinidad and Tobago | 0.7 /100 | #249 | Tragic 55.5% |
| Delaware | 0.7 /100 | #250 | Tragic 55.5% |
| Immigrants | Cambodia | 0.6 /100 | #251 | Tragic 55.4% |
| Aleuts | 0.6 /100 | #252 | Tragic 55.4% |
| Immigrants | Barbados | 0.6 /100 | #253 | Tragic 55.4% |
| Japanese | 0.5 /100 | #254 | Tragic 55.2% |
| Immigrants | Bahamas | 0.5 /100 | #255 | Tragic 55.2% |
| Immigrants | West Indies | 0.5 /100 | #256 | Tragic 55.2% |
| Indonesians | 0.4 /100 | #257 | Tragic 55.1% |
| Africans | 0.4 /100 | #258 | Tragic 55.0% |