Immigrants from Portugal vs Immigrants from Sudan Hearing Disability
COMPARE
Immigrants from Portugal
Immigrants from Sudan
Hearing Disability
Hearing Disability Comparison
Immigrants from Portugal
Immigrants from Sudan
3.2%
HEARING DISABILITY
4.3/ 100
METRIC RATING
228th/ 347
METRIC RANK
2.9%
HEARING DISABILITY
87.8/ 100
METRIC RATING
126th/ 347
METRIC RANK
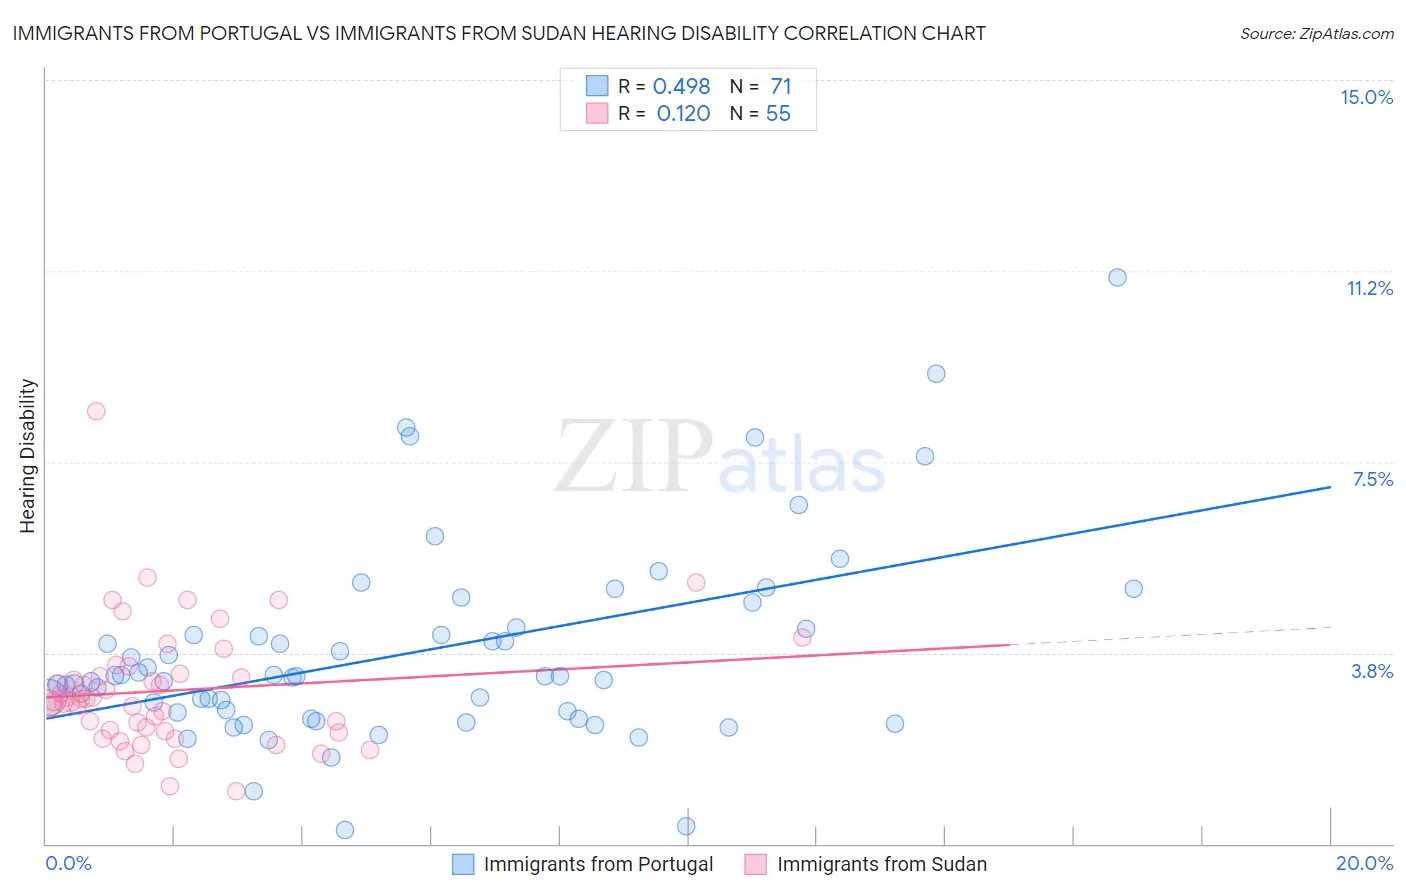
Immigrants from Portugal vs Immigrants from Sudan Hearing Disability Correlation Chart
The statistical analysis conducted on geographies consisting of 174,768,283 people shows a moderate positive correlation between the proportion of Immigrants from Portugal and percentage of population with hearing disability in the United States with a correlation coefficient (R) of 0.498 and weighted average of 3.2%. Similarly, the statistical analysis conducted on geographies consisting of 118,954,451 people shows a poor positive correlation between the proportion of Immigrants from Sudan and percentage of population with hearing disability in the United States with a correlation coefficient (R) of 0.120 and weighted average of 2.9%, a difference of 12.5%.
Hearing Disability Correlation Summary
| Measurement | Immigrants from Portugal | Immigrants from Sudan |
| Minimum | 0.28% | 1.0% |
| Maximum | 11.1% | 8.5% |
| Range | 10.8% | 7.5% |
| Mean | 3.7% | 3.0% |
| Median | 3.3% | 2.8% |
| Interquartile 25% (IQ1) | 2.6% | 2.2% |
| Interquartile 75% (IQ3) | 4.2% | 3.3% |
| Interquartile Range (IQR) | 1.6% | 1.1% |
| Standard Deviation (Sample) | 1.9% | 1.2% |
| Standard Deviation (Population) | 1.9% | 1.2% |
Similar Demographics by Hearing Disability
Demographics Similar to Immigrants from Portugal by Hearing Disability
In terms of hearing disability, the demographic groups most similar to Immigrants from Portugal are Maltese (3.2%, a difference of 0.11%), Bhutanese (3.2%, a difference of 0.20%), Lebanese (3.2%, a difference of 0.38%), Latvian (3.2%, a difference of 0.42%), and Icelander (3.2%, a difference of 0.47%).
| Demographics | Rating | Rank | Hearing Disability |
| Immigrants | Laos | 6.6 /100 | #221 | Tragic 3.2% |
| Immigrants | Oceania | 6.5 /100 | #222 | Tragic 3.2% |
| Mexicans | 5.6 /100 | #223 | Tragic 3.2% |
| Icelanders | 5.2 /100 | #224 | Tragic 3.2% |
| Latvians | 5.1 /100 | #225 | Tragic 3.2% |
| Lebanese | 5.0 /100 | #226 | Tragic 3.2% |
| Bhutanese | 4.6 /100 | #227 | Tragic 3.2% |
| Immigrants | Portugal | 4.3 /100 | #228 | Tragic 3.2% |
| Maltese | 4.1 /100 | #229 | Tragic 3.2% |
| Greeks | 3.2 /100 | #230 | Tragic 3.2% |
| Luxembourgers | 2.9 /100 | #231 | Tragic 3.2% |
| Ukrainians | 2.9 /100 | #232 | Tragic 3.2% |
| Estonians | 2.4 /100 | #233 | Tragic 3.3% |
| Central American Indians | 2.3 /100 | #234 | Tragic 3.3% |
| Guamanians/Chamorros | 2.2 /100 | #235 | Tragic 3.3% |
Demographics Similar to Immigrants from Sudan by Hearing Disability
In terms of hearing disability, the demographic groups most similar to Immigrants from Sudan are Immigrants from Albania (2.9%, a difference of 0.16%), Immigrants from Zaire (2.9%, a difference of 0.19%), Bahamian (2.9%, a difference of 0.19%), South American Indian (2.9%, a difference of 0.22%), and Immigrants from Western Asia (2.9%, a difference of 0.22%).
| Demographics | Rating | Rank | Hearing Disability |
| Kenyans | 89.8 /100 | #119 | Excellent 2.8% |
| Jordanians | 89.5 /100 | #120 | Excellent 2.8% |
| Cubans | 89.4 /100 | #121 | Excellent 2.8% |
| Liberians | 89.0 /100 | #122 | Excellent 2.8% |
| Immigrants | Zaire | 88.6 /100 | #123 | Excellent 2.9% |
| Bahamians | 88.6 /100 | #124 | Excellent 2.9% |
| Immigrants | Albania | 88.5 /100 | #125 | Excellent 2.9% |
| Immigrants | Sudan | 87.8 /100 | #126 | Excellent 2.9% |
| South American Indians | 86.9 /100 | #127 | Excellent 2.9% |
| Immigrants | Western Asia | 86.9 /100 | #128 | Excellent 2.9% |
| Immigrants | Uganda | 86.6 /100 | #129 | Excellent 2.9% |
| Immigrants | Vietnam | 86.5 /100 | #130 | Excellent 2.9% |
| Immigrants | Kenya | 86.1 /100 | #131 | Excellent 2.9% |
| Chileans | 85.8 /100 | #132 | Excellent 2.9% |
| Immigrants | Syria | 85.8 /100 | #133 | Excellent 2.9% |