Immigrants from Portugal vs Houma GED/Equivalency
COMPARE
Immigrants from Portugal
Houma
GED/Equivalency
GED/Equivalency Comparison
Immigrants from Portugal
Houma
81.6%
GED/EQUIVALENCY
0.0/ 100
METRIC RATING
303rd/ 347
METRIC RANK
75.0%
GED/EQUIVALENCY
0.0/ 100
METRIC RATING
346th/ 347
METRIC RANK
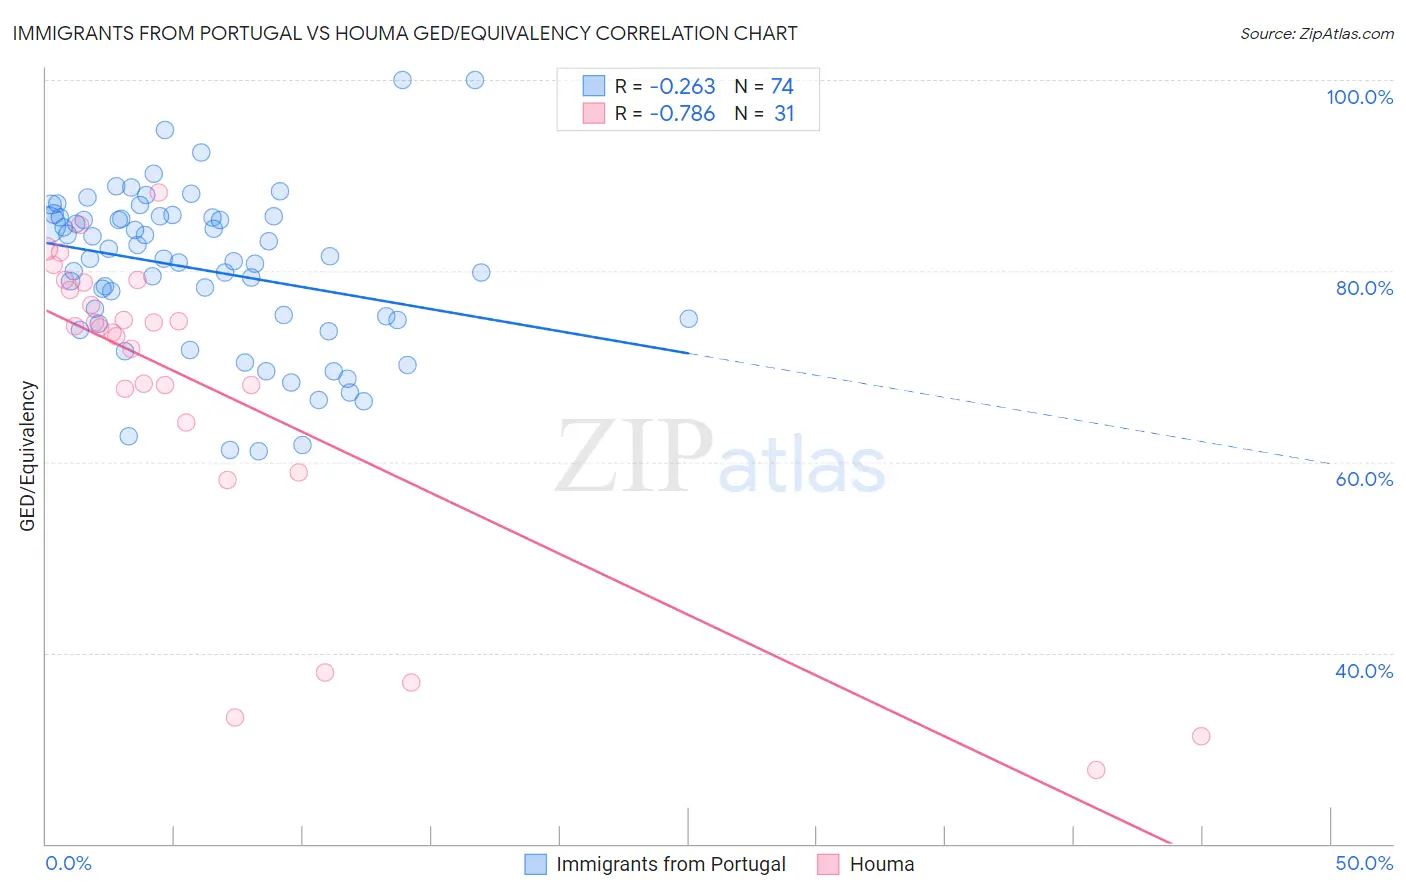
Immigrants from Portugal vs Houma GED/Equivalency Correlation Chart
The statistical analysis conducted on geographies consisting of 174,792,669 people shows a weak negative correlation between the proportion of Immigrants from Portugal and percentage of population with at least ged/equivalency education in the United States with a correlation coefficient (R) of -0.263 and weighted average of 81.6%. Similarly, the statistical analysis conducted on geographies consisting of 36,795,916 people shows a strong negative correlation between the proportion of Houma and percentage of population with at least ged/equivalency education in the United States with a correlation coefficient (R) of -0.786 and weighted average of 75.0%, a difference of 8.8%.
GED/Equivalency Correlation Summary
| Measurement | Immigrants from Portugal | Houma |
| Minimum | 61.1% | 27.8% |
| Maximum | 100.0% | 88.2% |
| Range | 38.9% | 60.4% |
| Mean | 80.1% | 67.6% |
| Median | 81.3% | 74.1% |
| Interquartile 25% (IQ1) | 74.9% | 64.2% |
| Interquartile 75% (IQ3) | 85.6% | 78.8% |
| Interquartile Range (IQR) | 10.7% | 14.6% |
| Standard Deviation (Sample) | 8.5% | 16.7% |
| Standard Deviation (Population) | 8.4% | 16.4% |
Similar Demographics by GED/Equivalency
Demographics Similar to Immigrants from Portugal by GED/Equivalency
In terms of ged/equivalency, the demographic groups most similar to Immigrants from Portugal are Immigrants from Haiti (81.6%, a difference of 0.0%), Dutch West Indian (81.6%, a difference of 0.040%), Fijian (81.6%, a difference of 0.10%), Navajo (81.5%, a difference of 0.10%), and Ecuadorian (81.7%, a difference of 0.17%).
| Demographics | Rating | Rank | GED/Equivalency |
| Vietnamese | 0.0 /100 | #296 | Tragic 81.9% |
| Immigrants | Bangladesh | 0.0 /100 | #297 | Tragic 81.9% |
| Ute | 0.0 /100 | #298 | Tragic 81.8% |
| Ecuadorians | 0.0 /100 | #299 | Tragic 81.7% |
| Fijians | 0.0 /100 | #300 | Tragic 81.6% |
| Dutch West Indians | 0.0 /100 | #301 | Tragic 81.6% |
| Immigrants | Haiti | 0.0 /100 | #302 | Tragic 81.6% |
| Immigrants | Portugal | 0.0 /100 | #303 | Tragic 81.6% |
| Navajo | 0.0 /100 | #304 | Tragic 81.5% |
| Immigrants | Grenada | 0.0 /100 | #305 | Tragic 81.3% |
| Guyanese | 0.0 /100 | #306 | Tragic 81.3% |
| Immigrants | Dominica | 0.0 /100 | #307 | Tragic 81.1% |
| Puerto Ricans | 0.0 /100 | #308 | Tragic 81.1% |
| Immigrants | Ecuador | 0.0 /100 | #309 | Tragic 81.0% |
| Immigrants | Guyana | 0.0 /100 | #310 | Tragic 81.0% |
Demographics Similar to Houma by GED/Equivalency
In terms of ged/equivalency, the demographic groups most similar to Houma are Yakama (74.5%, a difference of 0.61%), Immigrants from Mexico (75.7%, a difference of 0.94%), Spanish American Indian (76.3%, a difference of 1.8%), Immigrants from Central America (76.4%, a difference of 1.9%), and Pima (76.4%, a difference of 2.0%).
| Demographics | Rating | Rank | GED/Equivalency |
| Salvadorans | 0.0 /100 | #333 | Tragic 78.6% |
| Guatemalans | 0.0 /100 | #334 | Tragic 78.5% |
| Immigrants | Latin America | 0.0 /100 | #335 | Tragic 78.5% |
| Immigrants | Dominican Republic | 0.0 /100 | #336 | Tragic 78.0% |
| Immigrants | Yemen | 0.0 /100 | #337 | Tragic 77.9% |
| Immigrants | Guatemala | 0.0 /100 | #338 | Tragic 77.9% |
| Immigrants | El Salvador | 0.0 /100 | #339 | Tragic 77.6% |
| Tohono O'odham | 0.0 /100 | #340 | Tragic 77.5% |
| Mexicans | 0.0 /100 | #341 | Tragic 77.4% |
| Pima | 0.0 /100 | #342 | Tragic 76.4% |
| Immigrants | Central America | 0.0 /100 | #343 | Tragic 76.4% |
| Spanish American Indians | 0.0 /100 | #344 | Tragic 76.3% |
| Immigrants | Mexico | 0.0 /100 | #345 | Tragic 75.7% |
| Houma | 0.0 /100 | #346 | Tragic 75.0% |
| Yakama | 0.0 /100 | #347 | Tragic 74.5% |