Immigrants from Poland vs Immigrants from Western Africa College, Under 1 year
COMPARE
Immigrants from Poland
Immigrants from Western Africa
College, Under 1 year
College, Under 1 year Comparison
Immigrants from Poland
Immigrants from Western Africa
65.2%
COLLEGE, UNDER 1 YEAR
42.6/ 100
METRIC RATING
183rd/ 347
METRIC RANK
62.8%
COLLEGE, UNDER 1 YEAR
2.4/ 100
METRIC RATING
231st/ 347
METRIC RANK
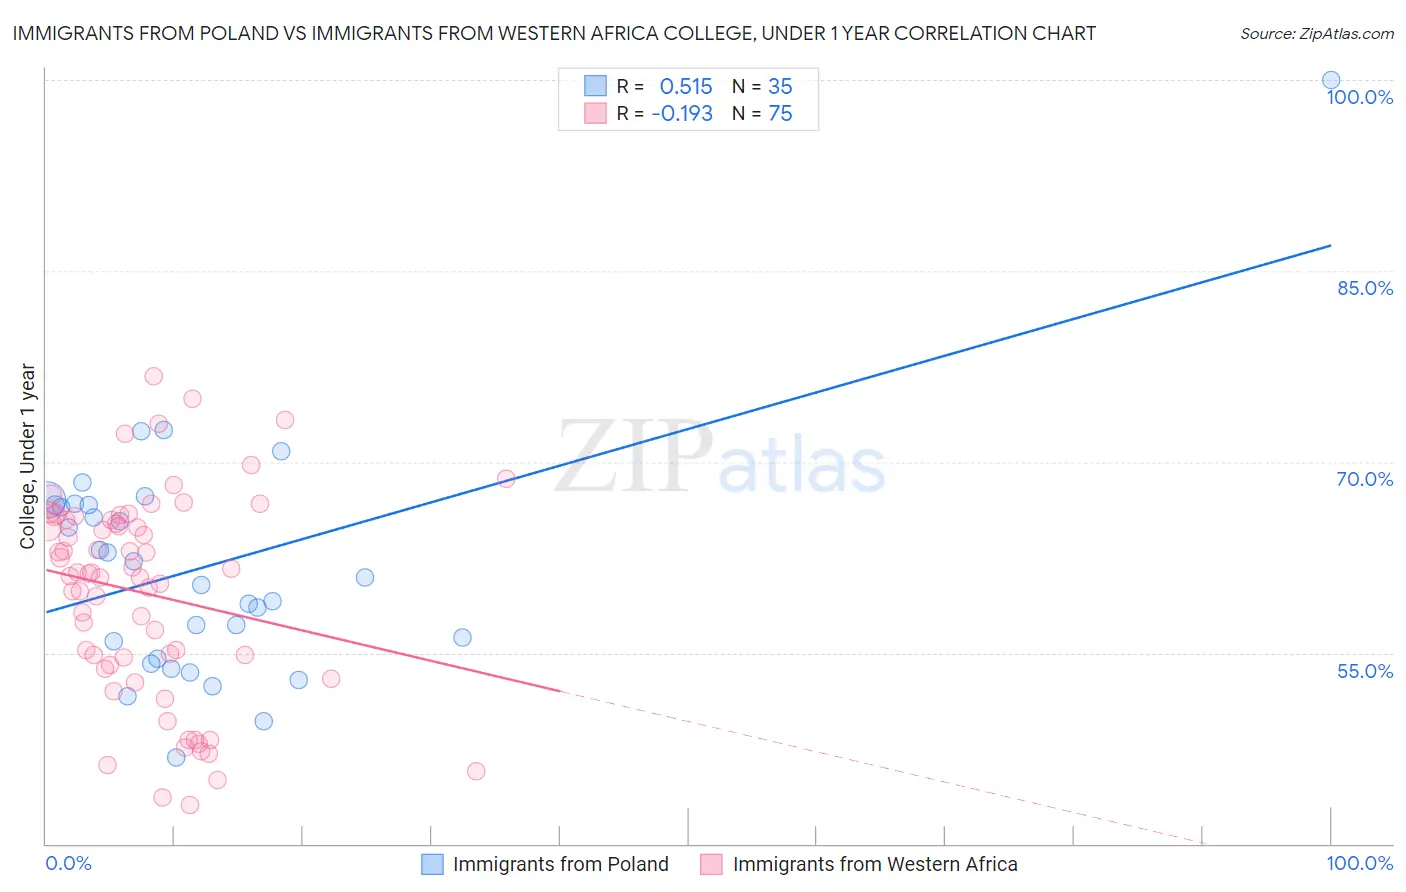
Immigrants from Poland vs Immigrants from Western Africa College, Under 1 year Correlation Chart
The statistical analysis conducted on geographies consisting of 304,861,877 people shows a substantial positive correlation between the proportion of Immigrants from Poland and percentage of population with at least college, under 1 year education in the United States with a correlation coefficient (R) of 0.515 and weighted average of 65.2%. Similarly, the statistical analysis conducted on geographies consisting of 357,885,062 people shows a poor negative correlation between the proportion of Immigrants from Western Africa and percentage of population with at least college, under 1 year education in the United States with a correlation coefficient (R) of -0.193 and weighted average of 62.8%, a difference of 3.9%.
College, Under 1 year Correlation Summary
| Measurement | Immigrants from Poland | Immigrants from Western Africa |
| Minimum | 46.7% | 43.0% |
| Maximum | 100.0% | 76.7% |
| Range | 53.3% | 33.7% |
| Mean | 61.8% | 59.7% |
| Median | 61.0% | 61.2% |
| Interquartile 25% (IQ1) | 54.6% | 54.1% |
| Interquartile 75% (IQ3) | 66.6% | 65.4% |
| Interquartile Range (IQR) | 12.0% | 11.4% |
| Standard Deviation (Sample) | 9.4% | 8.0% |
| Standard Deviation (Population) | 9.3% | 7.9% |
Similar Demographics by College, Under 1 year
Demographics Similar to Immigrants from Poland by College, Under 1 year
In terms of college, under 1 year, the demographic groups most similar to Immigrants from Poland are Bermudan (65.2%, a difference of 0.030%), Sri Lankan (65.2%, a difference of 0.040%), Immigrants from Africa (65.3%, a difference of 0.10%), Spaniard (65.3%, a difference of 0.13%), and Immigrants from Sierra Leone (65.1%, a difference of 0.13%).
| Demographics | Rating | Rank | College, Under 1 year |
| French | 48.9 /100 | #176 | Average 65.4% |
| Immigrants | North Macedonia | 48.6 /100 | #177 | Average 65.4% |
| German Russians | 48.3 /100 | #178 | Average 65.4% |
| Guamanians/Chamorros | 48.2 /100 | #179 | Average 65.4% |
| Dutch | 46.1 /100 | #180 | Average 65.3% |
| Spaniards | 45.5 /100 | #181 | Average 65.3% |
| Immigrants | Africa | 44.7 /100 | #182 | Average 65.3% |
| Immigrants | Poland | 42.6 /100 | #183 | Average 65.2% |
| Bermudans | 42.0 /100 | #184 | Average 65.2% |
| Sri Lankans | 41.7 /100 | #185 | Average 65.2% |
| Immigrants | Sierra Leone | 39.7 /100 | #186 | Fair 65.1% |
| Immigrants | Southern Europe | 34.3 /100 | #187 | Fair 64.9% |
| Immigrants | Albania | 32.0 /100 | #188 | Fair 64.9% |
| Spanish | 31.6 /100 | #189 | Fair 64.9% |
| Immigrants | Philippines | 30.1 /100 | #190 | Fair 64.8% |
Demographics Similar to Immigrants from Western Africa by College, Under 1 year
In terms of college, under 1 year, the demographic groups most similar to Immigrants from Western Africa are Osage (62.7%, a difference of 0.11%), Iroquois (62.6%, a difference of 0.22%), Nonimmigrants (62.9%, a difference of 0.24%), Chippewa (62.6%, a difference of 0.26%), and Liberian (63.0%, a difference of 0.31%).
| Demographics | Rating | Rank | College, Under 1 year |
| Sub-Saharan Africans | 4.4 /100 | #224 | Tragic 63.2% |
| Immigrants | Peru | 4.0 /100 | #225 | Tragic 63.1% |
| Immigrants | Colombia | 4.0 /100 | #226 | Tragic 63.1% |
| Immigrants | Ghana | 3.7 /100 | #227 | Tragic 63.1% |
| Samoans | 3.3 /100 | #228 | Tragic 63.0% |
| Liberians | 3.2 /100 | #229 | Tragic 63.0% |
| Immigrants | Nonimmigrants | 3.0 /100 | #230 | Tragic 62.9% |
| Immigrants | Western Africa | 2.4 /100 | #231 | Tragic 62.8% |
| Osage | 2.2 /100 | #232 | Tragic 62.7% |
| Iroquois | 2.0 /100 | #233 | Tragic 62.6% |
| Chippewa | 2.0 /100 | #234 | Tragic 62.6% |
| Spanish Americans | 1.9 /100 | #235 | Tragic 62.6% |
| Immigrants | Immigrants | 1.7 /100 | #236 | Tragic 62.5% |
| Immigrants | Burma/Myanmar | 1.6 /100 | #237 | Tragic 62.5% |
| French American Indians | 1.5 /100 | #238 | Tragic 62.4% |