Immigrants from North America vs Immigrants from West Indies GED/Equivalency
COMPARE
Immigrants from North America
Immigrants from West Indies
GED/Equivalency
GED/Equivalency Comparison
Immigrants from North America
Immigrants from West Indies
87.8%
GED/EQUIVALENCY
99.1/ 100
METRIC RATING
65th/ 347
METRIC RANK
82.4%
GED/EQUIVALENCY
0.0/ 100
METRIC RATING
286th/ 347
METRIC RANK
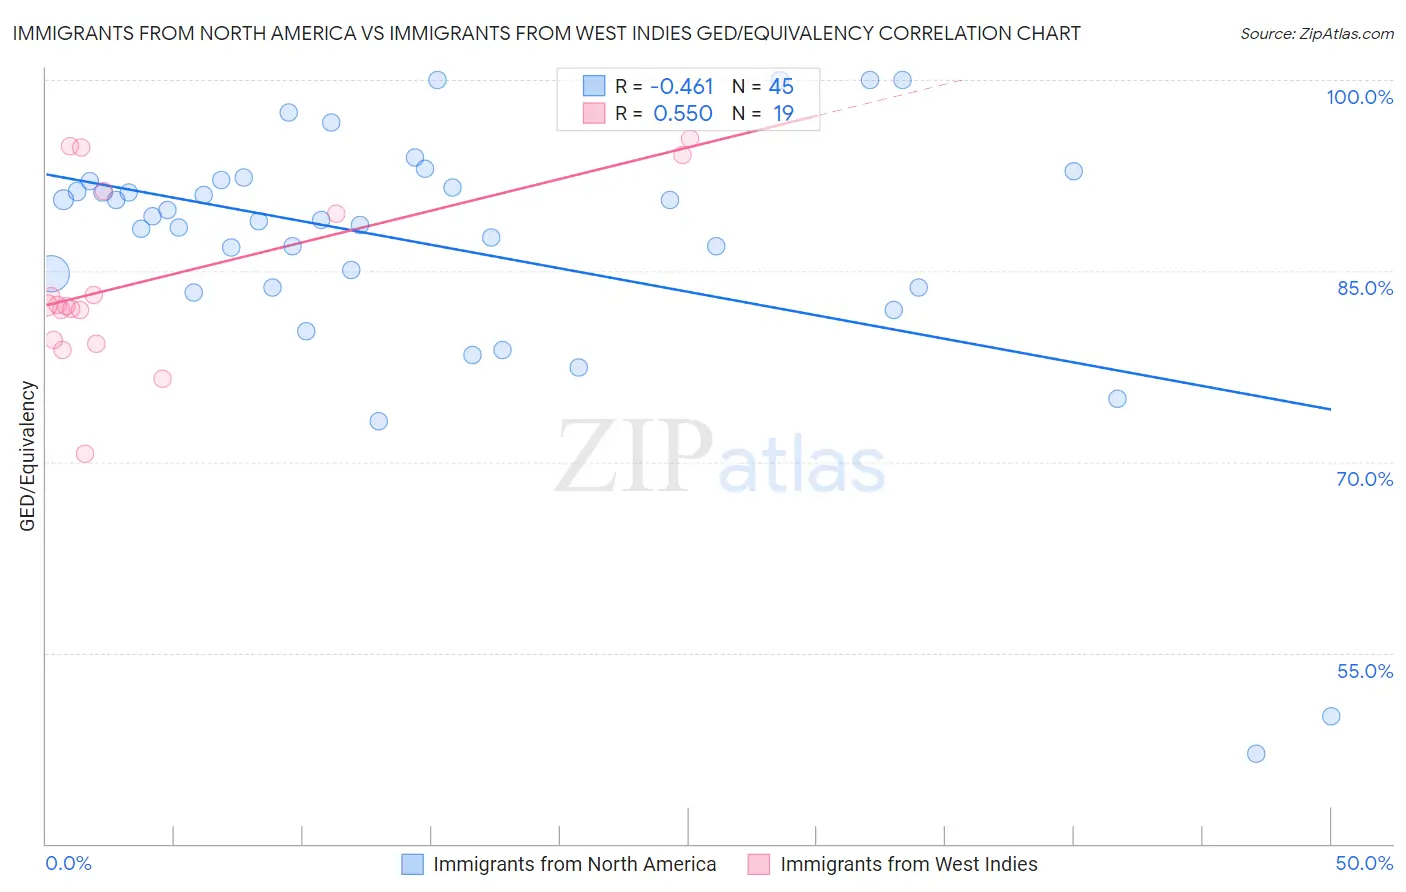
Immigrants from North America vs Immigrants from West Indies GED/Equivalency Correlation Chart
The statistical analysis conducted on geographies consisting of 462,461,910 people shows a moderate negative correlation between the proportion of Immigrants from North America and percentage of population with at least ged/equivalency education in the United States with a correlation coefficient (R) of -0.461 and weighted average of 87.8%. Similarly, the statistical analysis conducted on geographies consisting of 72,457,514 people shows a substantial positive correlation between the proportion of Immigrants from West Indies and percentage of population with at least ged/equivalency education in the United States with a correlation coefficient (R) of 0.550 and weighted average of 82.4%, a difference of 6.6%.
GED/Equivalency Correlation Summary
| Measurement | Immigrants from North America | Immigrants from West Indies |
| Minimum | 47.1% | 70.7% |
| Maximum | 100.0% | 95.4% |
| Range | 52.9% | 24.7% |
| Mean | 86.9% | 84.4% |
| Median | 89.0% | 82.3% |
| Interquartile 25% (IQ1) | 83.7% | 79.6% |
| Interquartile 75% (IQ3) | 92.1% | 91.2% |
| Interquartile Range (IQR) | 8.4% | 11.7% |
| Standard Deviation (Sample) | 10.5% | 7.0% |
| Standard Deviation (Population) | 10.4% | 6.8% |
Similar Demographics by GED/Equivalency
Demographics Similar to Immigrants from North America by GED/Equivalency
In terms of ged/equivalency, the demographic groups most similar to Immigrants from North America are Immigrants from Bulgaria (87.8%, a difference of 0.0%), British (87.8%, a difference of 0.010%), Immigrants from France (87.8%, a difference of 0.020%), Immigrants from Canada (87.9%, a difference of 0.030%), and Immigrants from Turkey (87.9%, a difference of 0.070%).
| Demographics | Rating | Rank | GED/Equivalency |
| Northern Europeans | 99.3 /100 | #58 | Exceptional 87.9% |
| Serbians | 99.3 /100 | #59 | Exceptional 87.9% |
| Scandinavians | 99.3 /100 | #60 | Exceptional 87.9% |
| Europeans | 99.3 /100 | #61 | Exceptional 87.9% |
| Germans | 99.3 /100 | #62 | Exceptional 87.9% |
| Immigrants | Turkey | 99.2 /100 | #63 | Exceptional 87.9% |
| Immigrants | Canada | 99.2 /100 | #64 | Exceptional 87.9% |
| Immigrants | North America | 99.1 /100 | #65 | Exceptional 87.8% |
| Immigrants | Bulgaria | 99.1 /100 | #66 | Exceptional 87.8% |
| British | 99.1 /100 | #67 | Exceptional 87.8% |
| Immigrants | France | 99.1 /100 | #68 | Exceptional 87.8% |
| Immigrants | Saudi Arabia | 99.0 /100 | #69 | Exceptional 87.8% |
| Ukrainians | 98.8 /100 | #70 | Exceptional 87.7% |
| Austrians | 98.8 /100 | #71 | Exceptional 87.7% |
| Immigrants | Moldova | 98.8 /100 | #72 | Exceptional 87.7% |
Demographics Similar to Immigrants from West Indies by GED/Equivalency
In terms of ged/equivalency, the demographic groups most similar to Immigrants from West Indies are Cajun (82.4%, a difference of 0.020%), Japanese (82.4%, a difference of 0.020%), Immigrants from Barbados (82.4%, a difference of 0.060%), Pueblo (82.3%, a difference of 0.12%), and Indonesian (82.5%, a difference of 0.18%).
| Demographics | Rating | Rank | GED/Equivalency |
| Immigrants | Fiji | 0.1 /100 | #279 | Tragic 82.7% |
| Cheyenne | 0.1 /100 | #280 | Tragic 82.7% |
| Sioux | 0.1 /100 | #281 | Tragic 82.6% |
| Immigrants | Immigrants | 0.1 /100 | #282 | Tragic 82.6% |
| Indonesians | 0.1 /100 | #283 | Tragic 82.5% |
| Immigrants | Barbados | 0.1 /100 | #284 | Tragic 82.4% |
| Cajuns | 0.0 /100 | #285 | Tragic 82.4% |
| Immigrants | West Indies | 0.0 /100 | #286 | Tragic 82.4% |
| Japanese | 0.0 /100 | #287 | Tragic 82.4% |
| Pueblo | 0.0 /100 | #288 | Tragic 82.3% |
| Immigrants | Cambodia | 0.0 /100 | #289 | Tragic 82.2% |
| Haitians | 0.0 /100 | #290 | Tragic 82.1% |
| Cubans | 0.0 /100 | #291 | Tragic 82.0% |
| Paiute | 0.0 /100 | #292 | Tragic 82.0% |
| British West Indians | 0.0 /100 | #293 | Tragic 82.0% |