South African vs Jamaican GED/Equivalency
COMPARE
South African
Jamaican
GED/Equivalency
GED/Equivalency Comparison
South Africans
Jamaicans
87.5%
GED/EQUIVALENCY
98.3/ 100
METRIC RATING
83rd/ 347
METRIC RANK
83.3%
GED/EQUIVALENCY
0.4/ 100
METRIC RATING
257th/ 347
METRIC RANK
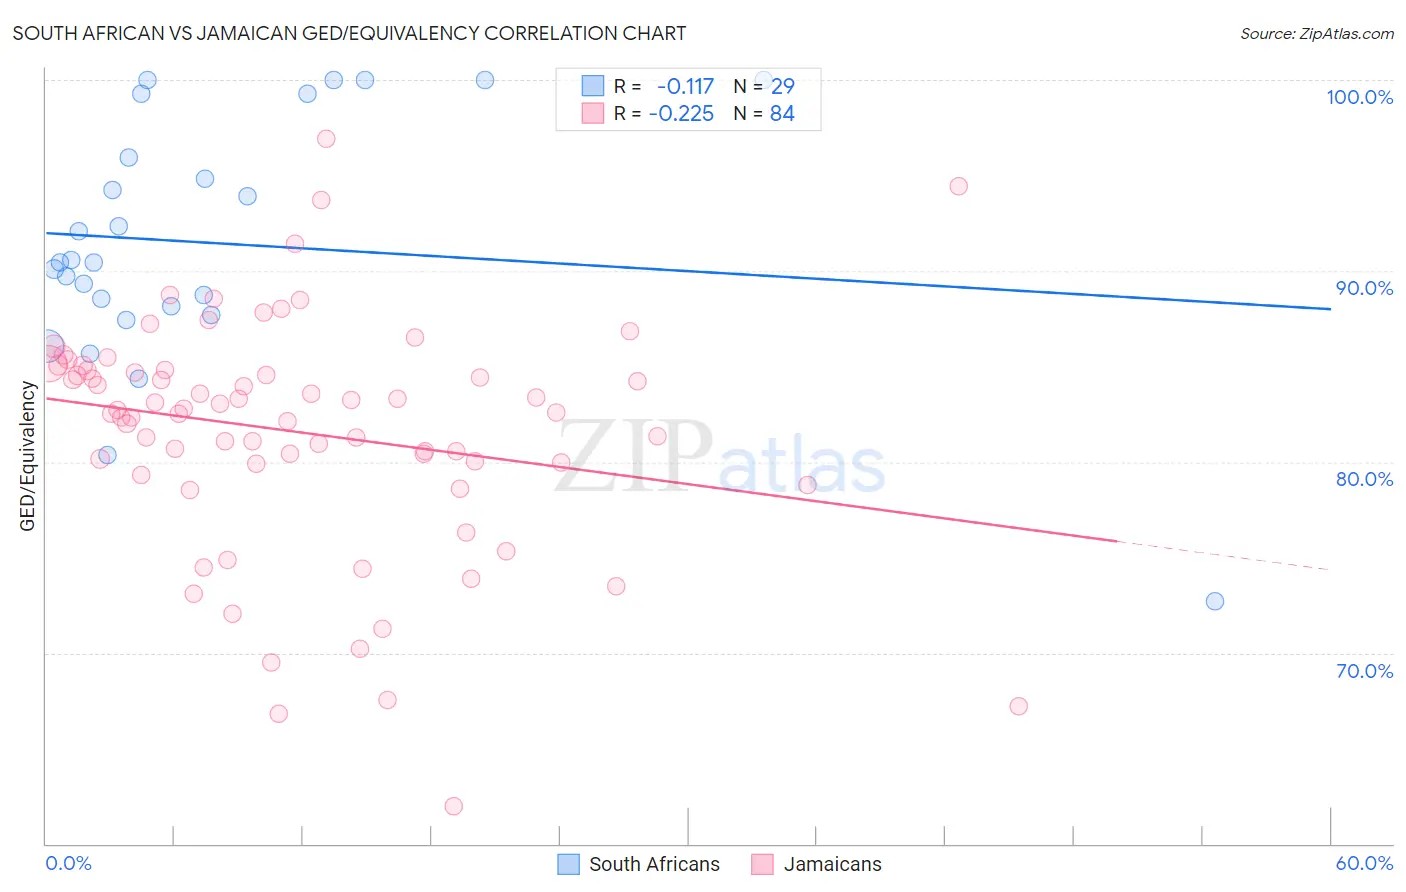
South African vs Jamaican GED/Equivalency Correlation Chart
The statistical analysis conducted on geographies consisting of 182,604,532 people shows a poor negative correlation between the proportion of South Africans and percentage of population with at least ged/equivalency education in the United States with a correlation coefficient (R) of -0.117 and weighted average of 87.5%. Similarly, the statistical analysis conducted on geographies consisting of 368,084,562 people shows a weak negative correlation between the proportion of Jamaicans and percentage of population with at least ged/equivalency education in the United States with a correlation coefficient (R) of -0.225 and weighted average of 83.3%, a difference of 5.1%.
GED/Equivalency Correlation Summary
| Measurement | South African | Jamaican |
| Minimum | 72.7% | 61.9% |
| Maximum | 100.0% | 96.9% |
| Range | 27.3% | 35.0% |
| Mean | 91.5% | 81.6% |
| Median | 90.4% | 82.7% |
| Interquartile 25% (IQ1) | 87.9% | 80.0% |
| Interquartile 75% (IQ3) | 97.6% | 84.8% |
| Interquartile Range (IQR) | 9.7% | 4.8% |
| Standard Deviation (Sample) | 6.5% | 6.2% |
| Standard Deviation (Population) | 6.4% | 6.1% |
Similar Demographics by GED/Equivalency
Demographics Similar to South Africans by GED/Equivalency
In terms of ged/equivalency, the demographic groups most similar to South Africans are Immigrants from Sri Lanka (87.5%, a difference of 0.010%), Romanian (87.5%, a difference of 0.010%), Immigrants from Romania (87.5%, a difference of 0.040%), Dutch (87.5%, a difference of 0.040%), and Immigrants from England (87.6%, a difference of 0.050%).
| Demographics | Rating | Rank | GED/Equivalency |
| Immigrants | Serbia | 98.7 /100 | #76 | Exceptional 87.7% |
| Slavs | 98.7 /100 | #77 | Exceptional 87.7% |
| Irish | 98.6 /100 | #78 | Exceptional 87.6% |
| English | 98.6 /100 | #79 | Exceptional 87.6% |
| Immigrants | England | 98.5 /100 | #80 | Exceptional 87.6% |
| Immigrants | Sri Lanka | 98.3 /100 | #81 | Exceptional 87.5% |
| Romanians | 98.3 /100 | #82 | Exceptional 87.5% |
| South Africans | 98.3 /100 | #83 | Exceptional 87.5% |
| Immigrants | Romania | 98.1 /100 | #84 | Exceptional 87.5% |
| Dutch | 98.1 /100 | #85 | Exceptional 87.5% |
| Immigrants | Europe | 98.1 /100 | #86 | Exceptional 87.5% |
| Native Hawaiians | 98.1 /100 | #87 | Exceptional 87.5% |
| Immigrants | Norway | 98.1 /100 | #88 | Exceptional 87.5% |
| Hungarians | 97.9 /100 | #89 | Exceptional 87.4% |
| Welsh | 97.9 /100 | #90 | Exceptional 87.4% |
Demographics Similar to Jamaicans by GED/Equivalency
In terms of ged/equivalency, the demographic groups most similar to Jamaicans are Malaysian (83.3%, a difference of 0.030%), African (83.4%, a difference of 0.13%), Colville (83.4%, a difference of 0.14%), Immigrants from Vietnam (83.2%, a difference of 0.17%), and Choctaw (83.1%, a difference of 0.20%).
| Demographics | Rating | Rank | GED/Equivalency |
| Shoshone | 1.0 /100 | #250 | Tragic 83.7% |
| Spanish Americans | 0.8 /100 | #251 | Tragic 83.6% |
| Bahamians | 0.8 /100 | #252 | Tragic 83.6% |
| Comanche | 0.7 /100 | #253 | Tragic 83.6% |
| Creek | 0.7 /100 | #254 | Tragic 83.6% |
| Colville | 0.5 /100 | #255 | Tragic 83.4% |
| Africans | 0.5 /100 | #256 | Tragic 83.4% |
| Jamaicans | 0.4 /100 | #257 | Tragic 83.3% |
| Malaysians | 0.4 /100 | #258 | Tragic 83.3% |
| Immigrants | Vietnam | 0.3 /100 | #259 | Tragic 83.2% |
| Choctaw | 0.3 /100 | #260 | Tragic 83.1% |
| Inupiat | 0.2 /100 | #261 | Tragic 83.1% |
| Immigrants | Armenia | 0.2 /100 | #262 | Tragic 83.1% |
| Immigrants | Congo | 0.2 /100 | #263 | Tragic 83.1% |
| Bangladeshis | 0.2 /100 | #264 | Tragic 83.1% |