Immigrants from Oceania vs Jamaican Kindergarten
COMPARE
Immigrants from Oceania
Jamaican
Kindergarten
Kindergarten Comparison
Immigrants from Oceania
Jamaicans
97.8%
KINDERGARTEN
11.1/ 100
METRIC RATING
210th/ 347
METRIC RANK
97.6%
KINDERGARTEN
0.6/ 100
METRIC RATING
258th/ 347
METRIC RANK
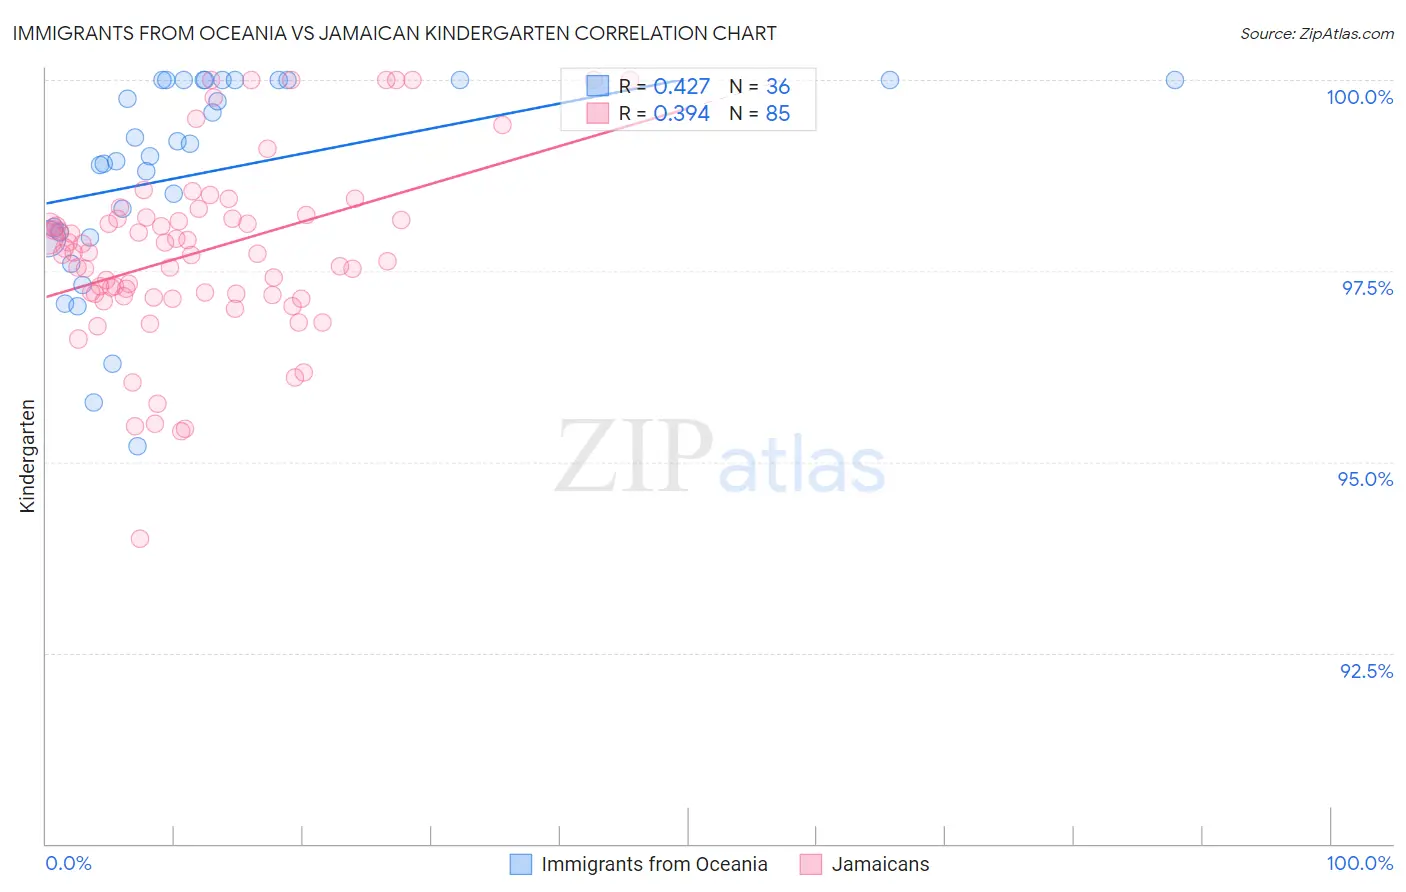
Immigrants from Oceania vs Jamaican Kindergarten Correlation Chart
The statistical analysis conducted on geographies consisting of 305,516,300 people shows a moderate positive correlation between the proportion of Immigrants from Oceania and percentage of population with at least kindergarten education in the United States with a correlation coefficient (R) of 0.427 and weighted average of 97.8%. Similarly, the statistical analysis conducted on geographies consisting of 368,084,732 people shows a mild positive correlation between the proportion of Jamaicans and percentage of population with at least kindergarten education in the United States with a correlation coefficient (R) of 0.394 and weighted average of 97.6%, a difference of 0.24%.
Kindergarten Correlation Summary
| Measurement | Immigrants from Oceania | Jamaican |
| Minimum | 95.2% | 94.0% |
| Maximum | 100.0% | 100.0% |
| Range | 4.8% | 6.0% |
| Mean | 98.8% | 97.7% |
| Median | 99.1% | 97.7% |
| Interquartile 25% (IQ1) | 98.0% | 97.2% |
| Interquartile 75% (IQ3) | 100.0% | 98.2% |
| Interquartile Range (IQR) | 2.0% | 1.0% |
| Standard Deviation (Sample) | 1.3% | 1.2% |
| Standard Deviation (Population) | 1.3% | 1.2% |
Similar Demographics by Kindergarten
Demographics Similar to Immigrants from Oceania by Kindergarten
In terms of kindergarten, the demographic groups most similar to Immigrants from Oceania are Costa Rican (97.8%, a difference of 0.0%), Laotian (97.8%, a difference of 0.0%), Immigrants from Northern Africa (97.8%, a difference of 0.010%), Moroccan (97.8%, a difference of 0.020%), and Immigrants from Albania (97.8%, a difference of 0.030%).
| Demographics | Rating | Rank | Kindergarten |
| Immigrants | Uganda | 18.8 /100 | #203 | Poor 97.8% |
| Immigrants | Chile | 18.1 /100 | #204 | Poor 97.8% |
| Immigrants | Southern Europe | 18.0 /100 | #205 | Poor 97.8% |
| Immigrants | Albania | 16.4 /100 | #206 | Poor 97.8% |
| Africans | 16.1 /100 | #207 | Poor 97.8% |
| Immigrants | Northern Africa | 12.0 /100 | #208 | Poor 97.8% |
| Costa Ricans | 11.6 /100 | #209 | Poor 97.8% |
| Immigrants | Oceania | 11.1 /100 | #210 | Poor 97.8% |
| Laotians | 10.5 /100 | #211 | Poor 97.8% |
| Moroccans | 8.9 /100 | #212 | Tragic 97.8% |
| South American Indians | 7.7 /100 | #213 | Tragic 97.8% |
| Uruguayans | 7.5 /100 | #214 | Tragic 97.8% |
| Immigrants | Bahamas | 7.4 /100 | #215 | Tragic 97.8% |
| Samoans | 6.9 /100 | #216 | Tragic 97.8% |
| Bahamians | 6.6 /100 | #217 | Tragic 97.8% |
Demographics Similar to Jamaicans by Kindergarten
In terms of kindergarten, the demographic groups most similar to Jamaicans are Immigrants from Colombia (97.6%, a difference of 0.010%), Armenian (97.6%, a difference of 0.010%), Immigrants from Asia (97.6%, a difference of 0.020%), Immigrants from Congo (97.6%, a difference of 0.020%), and Yaqui (97.6%, a difference of 0.020%).
| Demographics | Rating | Rank | Kindergarten |
| Ethiopians | 0.9 /100 | #251 | Tragic 97.6% |
| Immigrants | Iraq | 0.9 /100 | #252 | Tragic 97.6% |
| Immigrants | Africa | 0.8 /100 | #253 | Tragic 97.6% |
| Immigrants | Asia | 0.8 /100 | #254 | Tragic 97.6% |
| Immigrants | Congo | 0.8 /100 | #255 | Tragic 97.6% |
| Yaqui | 0.7 /100 | #256 | Tragic 97.6% |
| Immigrants | Colombia | 0.6 /100 | #257 | Tragic 97.6% |
| Jamaicans | 0.6 /100 | #258 | Tragic 97.6% |
| Armenians | 0.5 /100 | #259 | Tragic 97.6% |
| Fijians | 0.5 /100 | #260 | Tragic 97.5% |
| Taiwanese | 0.4 /100 | #261 | Tragic 97.5% |
| Immigrants | Ethiopia | 0.4 /100 | #262 | Tragic 97.5% |
| Immigrants | South America | 0.4 /100 | #263 | Tragic 97.5% |
| Assyrians/Chaldeans/Syriacs | 0.4 /100 | #264 | Tragic 97.5% |
| Cubans | 0.3 /100 | #265 | Tragic 97.5% |