Immigrants from Norway vs Paraguayan Doctorate Degree
COMPARE
Immigrants from Norway
Paraguayan
Doctorate Degree
Doctorate Degree Comparison
Immigrants from Norway
Paraguayans
2.4%
DOCTORATE DEGREE
100.0/ 100
METRIC RATING
50th/ 347
METRIC RANK
2.3%
DOCTORATE DEGREE
99.9/ 100
METRIC RATING
65th/ 347
METRIC RANK
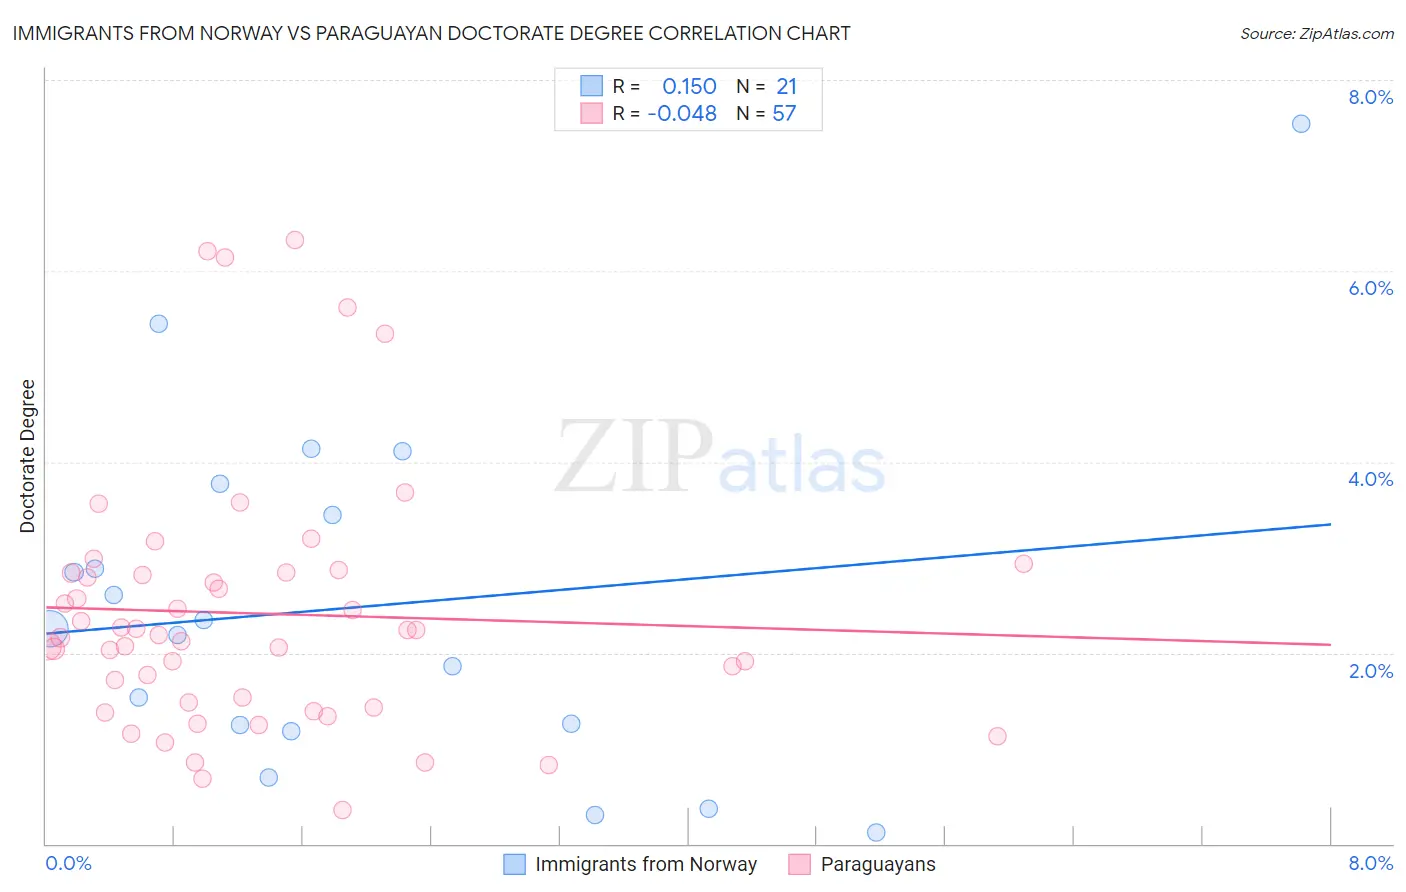
Immigrants from Norway vs Paraguayan Doctorate Degree Correlation Chart
The statistical analysis conducted on geographies consisting of 116,506,510 people shows a poor positive correlation between the proportion of Immigrants from Norway and percentage of population with at least doctorate degree education in the United States with a correlation coefficient (R) of 0.150 and weighted average of 2.4%. Similarly, the statistical analysis conducted on geographies consisting of 94,964,033 people shows no correlation between the proportion of Paraguayans and percentage of population with at least doctorate degree education in the United States with a correlation coefficient (R) of -0.048 and weighted average of 2.3%, a difference of 4.9%.
Doctorate Degree Correlation Summary
| Measurement | Immigrants from Norway | Paraguayan |
| Minimum | 0.12% | 0.35% |
| Maximum | 7.5% | 6.3% |
| Range | 7.4% | 6.0% |
| Mean | 2.5% | 2.4% |
| Median | 2.3% | 2.2% |
| Interquartile 25% (IQ1) | 1.2% | 1.5% |
| Interquartile 75% (IQ3) | 3.6% | 2.8% |
| Interquartile Range (IQR) | 2.4% | 1.4% |
| Standard Deviation (Sample) | 1.8% | 1.3% |
| Standard Deviation (Population) | 1.8% | 1.3% |
Demographics Similar to Immigrants from Norway and Paraguayans by Doctorate Degree
In terms of doctorate degree, the demographic groups most similar to Immigrants from Norway are Australian (2.4%, a difference of 0.090%), Bulgarian (2.4%, a difference of 0.56%), Immigrants from Latvia (2.4%, a difference of 0.68%), Immigrants from Asia (2.4%, a difference of 1.1%), and Asian (2.4%, a difference of 1.3%). Similarly, the demographic groups most similar to Paraguayans are Argentinean (2.3%, a difference of 0.17%), Immigrants from Greece (2.3%, a difference of 0.50%), Zimbabwean (2.3%, a difference of 0.63%), Laotian (2.3%, a difference of 0.90%), and Immigrants from Europe (2.3%, a difference of 1.0%).
| Demographics | Rating | Rank | Doctorate Degree |
| Immigrants | Western Europe | 100.0 /100 | #47 | Exceptional 2.4% |
| Asians | 100.0 /100 | #48 | Exceptional 2.4% |
| Immigrants | Asia | 100.0 /100 | #49 | Exceptional 2.4% |
| Immigrants | Norway | 100.0 /100 | #50 | Exceptional 2.4% |
| Australians | 100.0 /100 | #51 | Exceptional 2.4% |
| Bulgarians | 100.0 /100 | #52 | Exceptional 2.4% |
| Immigrants | Latvia | 100.0 /100 | #53 | Exceptional 2.4% |
| Immigrants | Indonesia | 100.0 /100 | #54 | Exceptional 2.4% |
| Bolivians | 100.0 /100 | #55 | Exceptional 2.4% |
| Immigrants | Czechoslovakia | 100.0 /100 | #56 | Exceptional 2.4% |
| Immigrants | Ethiopia | 100.0 /100 | #57 | Exceptional 2.4% |
| Ethiopians | 99.9 /100 | #58 | Exceptional 2.3% |
| South Africans | 99.9 /100 | #59 | Exceptional 2.3% |
| Immigrants | Serbia | 99.9 /100 | #60 | Exceptional 2.3% |
| Bhutanese | 99.9 /100 | #61 | Exceptional 2.3% |
| Immigrants | Europe | 99.9 /100 | #62 | Exceptional 2.3% |
| Laotians | 99.9 /100 | #63 | Exceptional 2.3% |
| Immigrants | Greece | 99.9 /100 | #64 | Exceptional 2.3% |
| Paraguayans | 99.9 /100 | #65 | Exceptional 2.3% |
| Argentineans | 99.9 /100 | #66 | Exceptional 2.3% |
| Zimbabweans | 99.8 /100 | #67 | Exceptional 2.3% |