Immigrants from South America vs Malaysian GED/Equivalency
COMPARE
Immigrants from South America
Malaysian
GED/Equivalency
GED/Equivalency Comparison
Immigrants from South America
Malaysians
84.4%
GED/EQUIVALENCY
4.2/ 100
METRIC RATING
232nd/ 347
METRIC RANK
83.3%
GED/EQUIVALENCY
0.4/ 100
METRIC RATING
258th/ 347
METRIC RANK
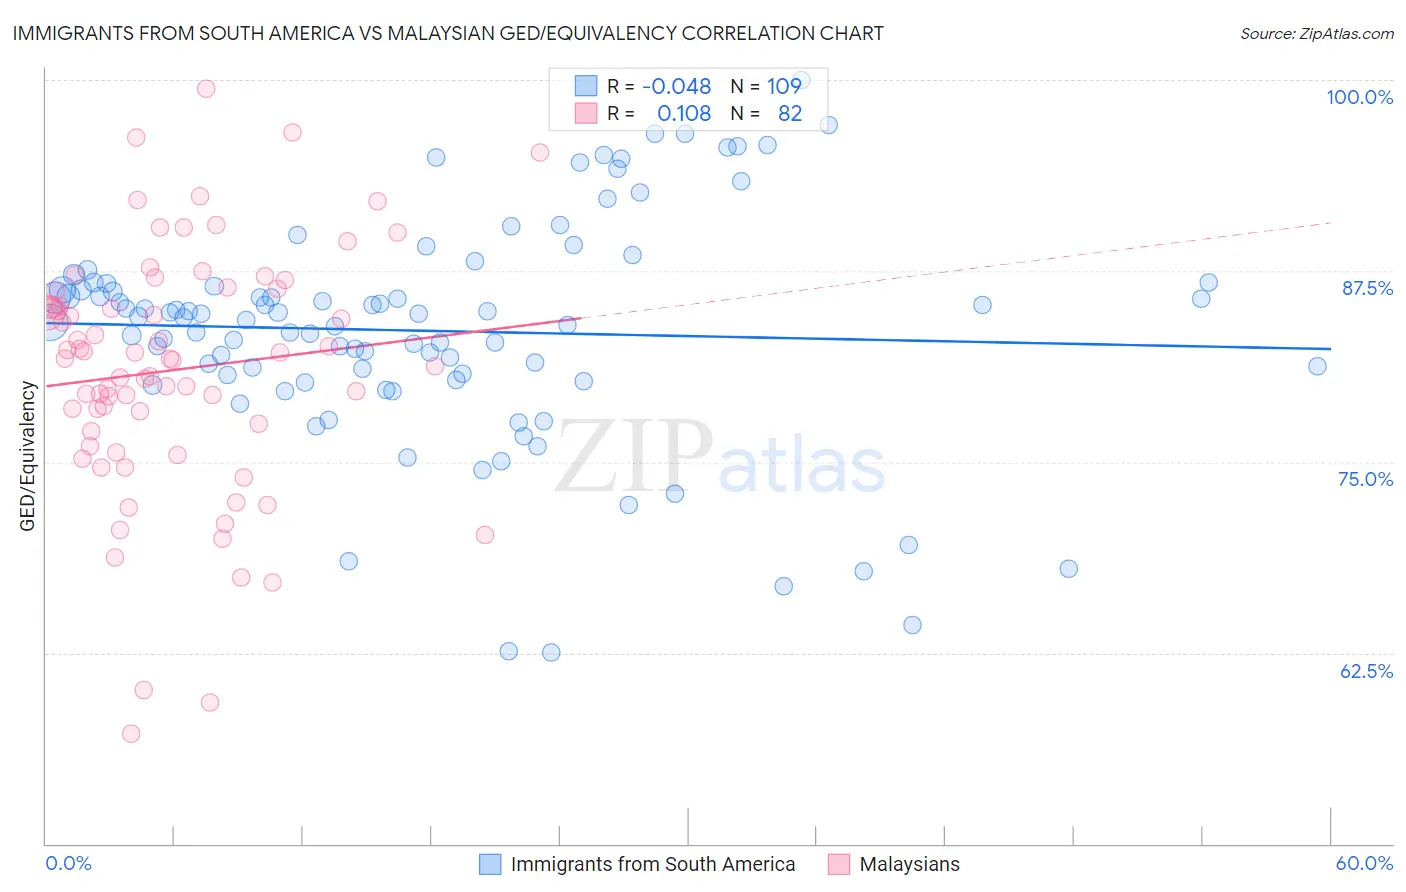
Immigrants from South America vs Malaysian GED/Equivalency Correlation Chart
The statistical analysis conducted on geographies consisting of 486,429,793 people shows no correlation between the proportion of Immigrants from South America and percentage of population with at least ged/equivalency education in the United States with a correlation coefficient (R) of -0.048 and weighted average of 84.4%. Similarly, the statistical analysis conducted on geographies consisting of 226,108,706 people shows a poor positive correlation between the proportion of Malaysians and percentage of population with at least ged/equivalency education in the United States with a correlation coefficient (R) of 0.108 and weighted average of 83.3%, a difference of 1.3%.
GED/Equivalency Correlation Summary
| Measurement | Immigrants from South America | Malaysian |
| Minimum | 62.5% | 57.2% |
| Maximum | 100.0% | 99.4% |
| Range | 37.5% | 42.2% |
| Mean | 83.6% | 81.0% |
| Median | 84.5% | 81.7% |
| Interquartile 25% (IQ1) | 80.5% | 77.0% |
| Interquartile 75% (IQ3) | 86.6% | 86.1% |
| Interquartile Range (IQR) | 6.0% | 9.2% |
| Standard Deviation (Sample) | 7.4% | 8.1% |
| Standard Deviation (Population) | 7.3% | 8.0% |
Similar Demographics by GED/Equivalency
Demographics Similar to Immigrants from South America by GED/Equivalency
In terms of ged/equivalency, the demographic groups most similar to Immigrants from South America are Immigrants from Panama (84.4%, a difference of 0.010%), Immigrants from Middle Africa (84.4%, a difference of 0.020%), Immigrants from Colombia (84.4%, a difference of 0.040%), Immigrants from Uruguay (84.4%, a difference of 0.050%), and Immigrants from Nigeria (84.3%, a difference of 0.080%).
| Demographics | Rating | Rank | GED/Equivalency |
| Immigrants | Thailand | 5.8 /100 | #225 | Tragic 84.5% |
| Immigrants | Zaire | 5.5 /100 | #226 | Tragic 84.5% |
| Immigrants | Costa Rica | 5.4 /100 | #227 | Tragic 84.5% |
| Immigrants | Liberia | 4.9 /100 | #228 | Tragic 84.4% |
| Immigrants | Uruguay | 4.6 /100 | #229 | Tragic 84.4% |
| Immigrants | Colombia | 4.5 /100 | #230 | Tragic 84.4% |
| Immigrants | Middle Africa | 4.3 /100 | #231 | Tragic 84.4% |
| Immigrants | South America | 4.2 /100 | #232 | Tragic 84.4% |
| Immigrants | Panama | 4.1 /100 | #233 | Tragic 84.4% |
| Immigrants | Nigeria | 3.6 /100 | #234 | Tragic 84.3% |
| Ghanaians | 3.5 /100 | #235 | Tragic 84.3% |
| Immigrants | Eritrea | 3.5 /100 | #236 | Tragic 84.3% |
| Sub-Saharan Africans | 3.0 /100 | #237 | Tragic 84.2% |
| Immigrants | Peru | 2.7 /100 | #238 | Tragic 84.2% |
| Immigrants | Bahamas | 2.6 /100 | #239 | Tragic 84.2% |
Demographics Similar to Malaysians by GED/Equivalency
In terms of ged/equivalency, the demographic groups most similar to Malaysians are Jamaican (83.3%, a difference of 0.030%), Immigrants from Vietnam (83.2%, a difference of 0.14%), African (83.4%, a difference of 0.16%), Colville (83.4%, a difference of 0.17%), and Choctaw (83.1%, a difference of 0.17%).
| Demographics | Rating | Rank | GED/Equivalency |
| Spanish Americans | 0.8 /100 | #251 | Tragic 83.6% |
| Bahamians | 0.8 /100 | #252 | Tragic 83.6% |
| Comanche | 0.7 /100 | #253 | Tragic 83.6% |
| Creek | 0.7 /100 | #254 | Tragic 83.6% |
| Colville | 0.5 /100 | #255 | Tragic 83.4% |
| Africans | 0.5 /100 | #256 | Tragic 83.4% |
| Jamaicans | 0.4 /100 | #257 | Tragic 83.3% |
| Malaysians | 0.4 /100 | #258 | Tragic 83.3% |
| Immigrants | Vietnam | 0.3 /100 | #259 | Tragic 83.2% |
| Choctaw | 0.3 /100 | #260 | Tragic 83.1% |
| Inupiat | 0.2 /100 | #261 | Tragic 83.1% |
| Immigrants | Armenia | 0.2 /100 | #262 | Tragic 83.1% |
| Immigrants | Congo | 0.2 /100 | #263 | Tragic 83.1% |
| Bangladeshis | 0.2 /100 | #264 | Tragic 83.1% |
| West Indians | 0.2 /100 | #265 | Tragic 83.1% |