Immigrants from Korea vs Immigrants from Lithuania College, Under 1 year
COMPARE
Immigrants from Korea
Immigrants from Lithuania
College, Under 1 year
College, Under 1 year Comparison
Immigrants from Korea
Immigrants from Lithuania
71.6%
COLLEGE, UNDER 1 YEAR
100.0/ 100
METRIC RATING
20th/ 347
METRIC RANK
70.3%
COLLEGE, UNDER 1 YEAR
99.9/ 100
METRIC RATING
42nd/ 347
METRIC RANK
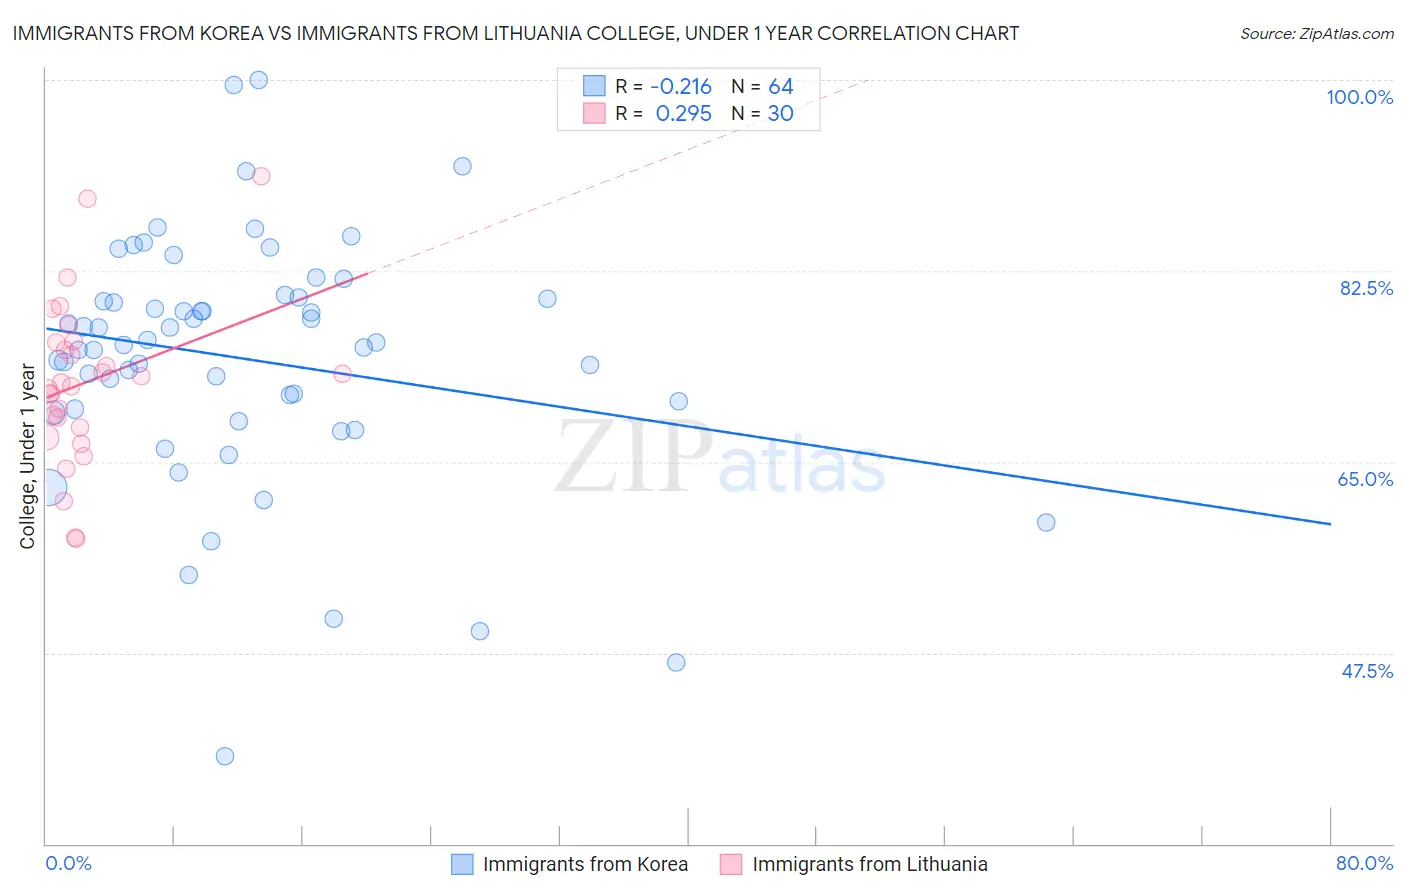
Immigrants from Korea vs Immigrants from Lithuania College, Under 1 year Correlation Chart
The statistical analysis conducted on geographies consisting of 416,336,700 people shows a weak negative correlation between the proportion of Immigrants from Korea and percentage of population with at least college, under 1 year education in the United States with a correlation coefficient (R) of -0.216 and weighted average of 71.6%. Similarly, the statistical analysis conducted on geographies consisting of 117,724,932 people shows a weak positive correlation between the proportion of Immigrants from Lithuania and percentage of population with at least college, under 1 year education in the United States with a correlation coefficient (R) of 0.295 and weighted average of 70.3%, a difference of 1.8%.
College, Under 1 year Correlation Summary
| Measurement | Immigrants from Korea | Immigrants from Lithuania |
| Minimum | 38.0% | 57.9% |
| Maximum | 100.0% | 91.2% |
| Range | 62.0% | 33.3% |
| Mean | 74.4% | 72.3% |
| Median | 75.8% | 72.1% |
| Interquartile 25% (IQ1) | 69.7% | 68.2% |
| Interquartile 75% (IQ3) | 80.0% | 76.0% |
| Interquartile Range (IQR) | 10.3% | 7.8% |
| Standard Deviation (Sample) | 11.4% | 7.5% |
| Standard Deviation (Population) | 11.3% | 7.4% |
Similar Demographics by College, Under 1 year
Demographics Similar to Immigrants from Korea by College, Under 1 year
In terms of college, under 1 year, the demographic groups most similar to Immigrants from Korea are Latvian (71.6%, a difference of 0.040%), Immigrants from Switzerland (71.7%, a difference of 0.15%), Immigrants from Belgium (71.5%, a difference of 0.15%), Eastern European (71.8%, a difference of 0.28%), and Immigrants from Eastern Asia (71.3%, a difference of 0.40%).
| Demographics | Rating | Rank | College, Under 1 year |
| Cypriots | 100.0 /100 | #13 | Exceptional 72.0% |
| Cambodians | 100.0 /100 | #14 | Exceptional 71.9% |
| Burmese | 100.0 /100 | #15 | Exceptional 71.9% |
| Immigrants | Japan | 100.0 /100 | #16 | Exceptional 71.9% |
| Eastern Europeans | 100.0 /100 | #17 | Exceptional 71.8% |
| Immigrants | Switzerland | 100.0 /100 | #18 | Exceptional 71.7% |
| Latvians | 100.0 /100 | #19 | Exceptional 71.6% |
| Immigrants | Korea | 100.0 /100 | #20 | Exceptional 71.6% |
| Immigrants | Belgium | 100.0 /100 | #21 | Exceptional 71.5% |
| Immigrants | Eastern Asia | 100.0 /100 | #22 | Exceptional 71.3% |
| Immigrants | Northern Europe | 100.0 /100 | #23 | Exceptional 71.1% |
| Soviet Union | 100.0 /100 | #24 | Exceptional 71.1% |
| Bulgarians | 100.0 /100 | #25 | Exceptional 71.1% |
| Immigrants | Denmark | 100.0 /100 | #26 | Exceptional 71.0% |
| Immigrants | Ireland | 100.0 /100 | #27 | Exceptional 71.0% |
Demographics Similar to Immigrants from Lithuania by College, Under 1 year
In terms of college, under 1 year, the demographic groups most similar to Immigrants from Lithuania are Immigrants from Kuwait (70.3%, a difference of 0.050%), Israeli (70.2%, a difference of 0.070%), New Zealander (70.2%, a difference of 0.070%), Immigrants from Turkey (70.3%, a difference of 0.090%), and Immigrants from Norway (70.2%, a difference of 0.090%).
| Demographics | Rating | Rank | College, Under 1 year |
| Russians | 99.9 /100 | #35 | Exceptional 70.5% |
| Immigrants | Sri Lanka | 99.9 /100 | #36 | Exceptional 70.5% |
| Immigrants | Saudi Arabia | 99.9 /100 | #37 | Exceptional 70.4% |
| Australians | 99.9 /100 | #38 | Exceptional 70.4% |
| Bhutanese | 99.9 /100 | #39 | Exceptional 70.3% |
| Immigrants | Turkey | 99.9 /100 | #40 | Exceptional 70.3% |
| Immigrants | Kuwait | 99.9 /100 | #41 | Exceptional 70.3% |
| Immigrants | Lithuania | 99.9 /100 | #42 | Exceptional 70.3% |
| Israelis | 99.9 /100 | #43 | Exceptional 70.2% |
| New Zealanders | 99.9 /100 | #44 | Exceptional 70.2% |
| Immigrants | Norway | 99.9 /100 | #45 | Exceptional 70.2% |
| Immigrants | Latvia | 99.9 /100 | #46 | Exceptional 70.1% |
| Immigrants | Bulgaria | 99.8 /100 | #47 | Exceptional 70.0% |
| Immigrants | Netherlands | 99.8 /100 | #48 | Exceptional 70.0% |
| Immigrants | Austria | 99.8 /100 | #49 | Exceptional 70.0% |