Immigrants from Kazakhstan vs Immigrants from Lithuania College, Under 1 year
COMPARE
Immigrants from Kazakhstan
Immigrants from Lithuania
College, Under 1 year
College, Under 1 year Comparison
Immigrants from Kazakhstan
Immigrants from Lithuania
69.2%
COLLEGE, UNDER 1 YEAR
99.5/ 100
METRIC RATING
61st/ 347
METRIC RANK
70.3%
COLLEGE, UNDER 1 YEAR
99.9/ 100
METRIC RATING
42nd/ 347
METRIC RANK
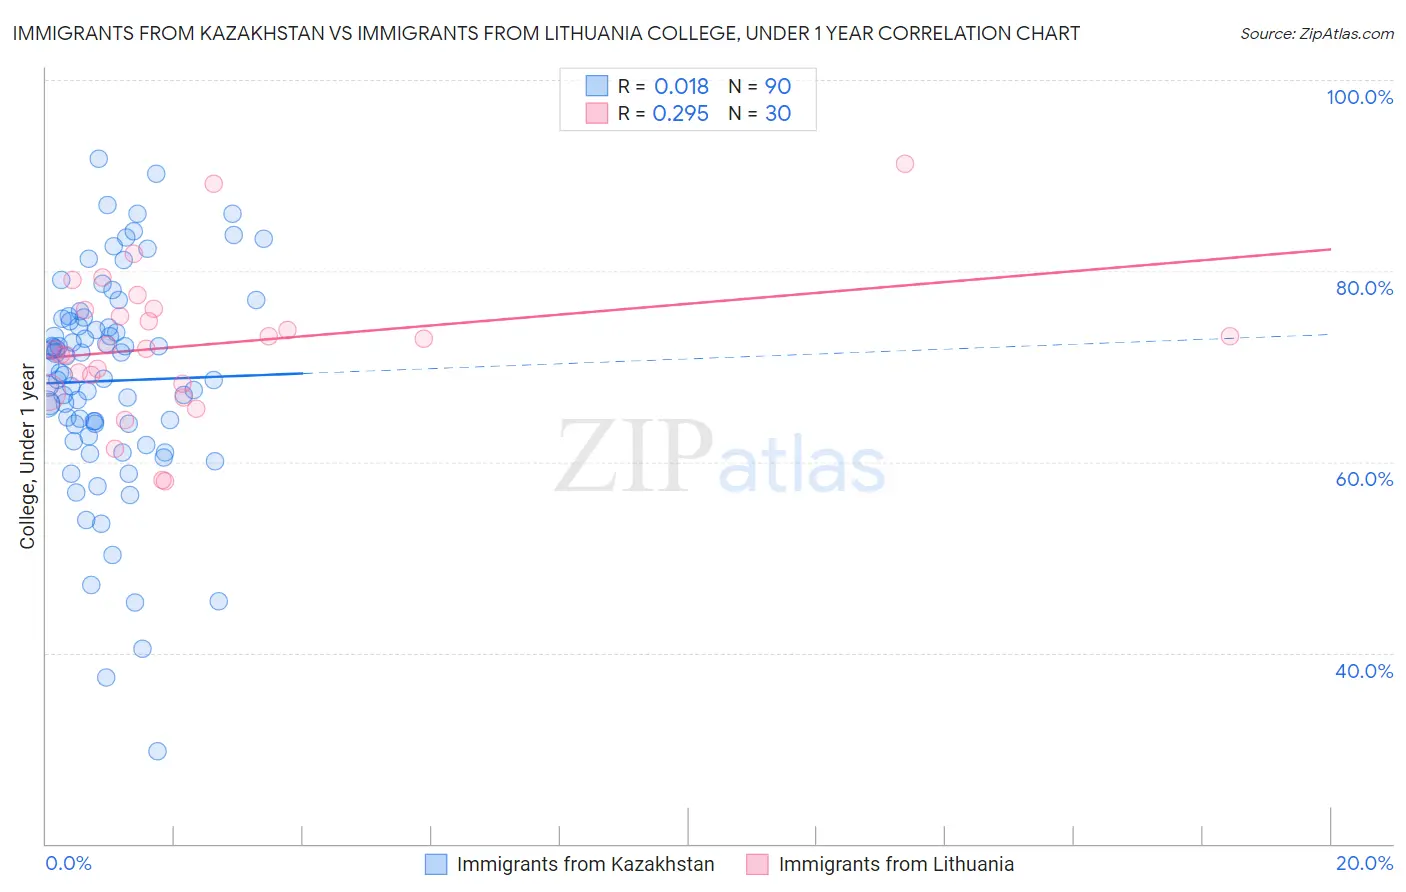
Immigrants from Kazakhstan vs Immigrants from Lithuania College, Under 1 year Correlation Chart
The statistical analysis conducted on geographies consisting of 124,443,390 people shows no correlation between the proportion of Immigrants from Kazakhstan and percentage of population with at least college, under 1 year education in the United States with a correlation coefficient (R) of 0.018 and weighted average of 69.2%. Similarly, the statistical analysis conducted on geographies consisting of 117,724,932 people shows a weak positive correlation between the proportion of Immigrants from Lithuania and percentage of population with at least college, under 1 year education in the United States with a correlation coefficient (R) of 0.295 and weighted average of 70.3%, a difference of 1.6%.
College, Under 1 year Correlation Summary
| Measurement | Immigrants from Kazakhstan | Immigrants from Lithuania |
| Minimum | 29.7% | 57.9% |
| Maximum | 91.8% | 91.2% |
| Range | 62.1% | 33.3% |
| Mean | 68.5% | 72.3% |
| Median | 69.2% | 72.1% |
| Interquartile 25% (IQ1) | 63.9% | 68.2% |
| Interquartile 75% (IQ3) | 74.7% | 76.0% |
| Interquartile Range (IQR) | 10.8% | 7.8% |
| Standard Deviation (Sample) | 11.3% | 7.5% |
| Standard Deviation (Population) | 11.2% | 7.4% |
Demographics Similar to Immigrants from Kazakhstan and Immigrants from Lithuania by College, Under 1 year
In terms of college, under 1 year, the demographic groups most similar to Immigrants from Kazakhstan are Immigrants from Asia (69.2%, a difference of 0.040%), Immigrants from Serbia (69.3%, a difference of 0.13%), Immigrants from Malaysia (69.3%, a difference of 0.26%), Asian (69.4%, a difference of 0.35%), and Immigrants from Scotland (69.4%, a difference of 0.38%). Similarly, the demographic groups most similar to Immigrants from Lithuania are Immigrants from Kuwait (70.3%, a difference of 0.050%), Israeli (70.2%, a difference of 0.070%), New Zealander (70.2%, a difference of 0.070%), Immigrants from Norway (70.2%, a difference of 0.090%), and Immigrants from Latvia (70.1%, a difference of 0.21%).
| Demographics | Rating | Rank | College, Under 1 year |
| Immigrants | Kuwait | 99.9 /100 | #41 | Exceptional 70.3% |
| Immigrants | Lithuania | 99.9 /100 | #42 | Exceptional 70.3% |
| Israelis | 99.9 /100 | #43 | Exceptional 70.2% |
| New Zealanders | 99.9 /100 | #44 | Exceptional 70.2% |
| Immigrants | Norway | 99.9 /100 | #45 | Exceptional 70.2% |
| Immigrants | Latvia | 99.9 /100 | #46 | Exceptional 70.1% |
| Immigrants | Bulgaria | 99.8 /100 | #47 | Exceptional 70.0% |
| Immigrants | Netherlands | 99.8 /100 | #48 | Exceptional 70.0% |
| Immigrants | Austria | 99.8 /100 | #49 | Exceptional 70.0% |
| Zimbabweans | 99.8 /100 | #50 | Exceptional 69.9% |
| Mongolians | 99.8 /100 | #51 | Exceptional 69.9% |
| Immigrants | Russia | 99.8 /100 | #52 | Exceptional 69.9% |
| South Africans | 99.7 /100 | #53 | Exceptional 69.7% |
| Immigrants | Czechoslovakia | 99.7 /100 | #54 | Exceptional 69.6% |
| Maltese | 99.7 /100 | #55 | Exceptional 69.5% |
| Immigrants | Scotland | 99.6 /100 | #56 | Exceptional 69.4% |
| Asians | 99.6 /100 | #57 | Exceptional 69.4% |
| Immigrants | Malaysia | 99.6 /100 | #58 | Exceptional 69.3% |
| Immigrants | Serbia | 99.5 /100 | #59 | Exceptional 69.3% |
| Immigrants | Asia | 99.5 /100 | #60 | Exceptional 69.2% |
| Immigrants | Kazakhstan | 99.5 /100 | #61 | Exceptional 69.2% |