Immigrants from Panama vs Immigrants from Lithuania College, Under 1 year
COMPARE
Immigrants from Panama
Immigrants from Lithuania
College, Under 1 year
College, Under 1 year Comparison
Immigrants from Panama
Immigrants from Lithuania
63.4%
COLLEGE, UNDER 1 YEAR
5.7/ 100
METRIC RATING
218th/ 347
METRIC RANK
70.3%
COLLEGE, UNDER 1 YEAR
99.9/ 100
METRIC RATING
42nd/ 347
METRIC RANK
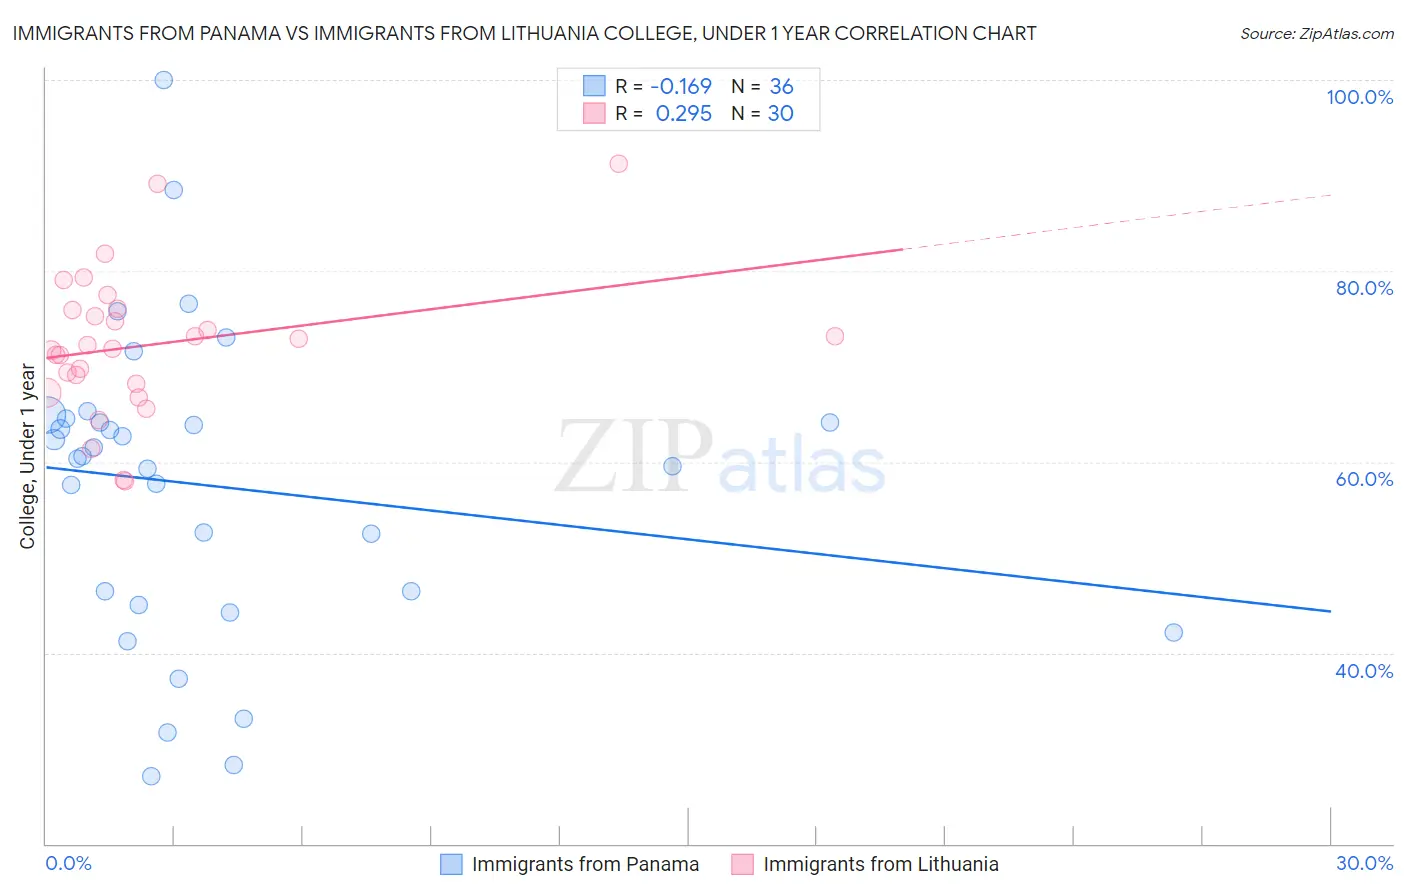
Immigrants from Panama vs Immigrants from Lithuania College, Under 1 year Correlation Chart
The statistical analysis conducted on geographies consisting of 221,184,524 people shows a poor negative correlation between the proportion of Immigrants from Panama and percentage of population with at least college, under 1 year education in the United States with a correlation coefficient (R) of -0.169 and weighted average of 63.4%. Similarly, the statistical analysis conducted on geographies consisting of 117,724,932 people shows a weak positive correlation between the proportion of Immigrants from Lithuania and percentage of population with at least college, under 1 year education in the United States with a correlation coefficient (R) of 0.295 and weighted average of 70.3%, a difference of 10.8%.
College, Under 1 year Correlation Summary
| Measurement | Immigrants from Panama | Immigrants from Lithuania |
| Minimum | 27.1% | 57.9% |
| Maximum | 100.0% | 91.2% |
| Range | 72.9% | 33.3% |
| Mean | 57.5% | 72.3% |
| Median | 60.4% | 72.1% |
| Interquartile 25% (IQ1) | 45.7% | 68.2% |
| Interquartile 75% (IQ3) | 64.4% | 76.0% |
| Interquartile Range (IQR) | 18.6% | 7.8% |
| Standard Deviation (Sample) | 16.0% | 7.5% |
| Standard Deviation (Population) | 15.8% | 7.4% |
Similar Demographics by College, Under 1 year
Demographics Similar to Immigrants from Panama by College, Under 1 year
In terms of college, under 1 year, the demographic groups most similar to Immigrants from Panama are Immigrants from Fiji (63.4%, a difference of 0.010%), Immigrants from Uruguay (63.4%, a difference of 0.020%), Portuguese (63.4%, a difference of 0.030%), Cree (63.3%, a difference of 0.11%), and Immigrants from Senegal (63.3%, a difference of 0.16%).
| Demographics | Rating | Rank | College, Under 1 year |
| Native Hawaiians | 10.6 /100 | #211 | Poor 63.9% |
| Immigrants | Middle Africa | 10.5 /100 | #212 | Poor 63.9% |
| Immigrants | South America | 9.1 /100 | #213 | Tragic 63.8% |
| Immigrants | Nigeria | 8.8 /100 | #214 | Tragic 63.7% |
| Senegalese | 7.7 /100 | #215 | Tragic 63.6% |
| Hmong | 6.8 /100 | #216 | Tragic 63.5% |
| Immigrants | Uruguay | 5.8 /100 | #217 | Tragic 63.4% |
| Immigrants | Panama | 5.7 /100 | #218 | Tragic 63.4% |
| Immigrants | Fiji | 5.7 /100 | #219 | Tragic 63.4% |
| Portuguese | 5.6 /100 | #220 | Tragic 63.4% |
| Cree | 5.2 /100 | #221 | Tragic 63.3% |
| Immigrants | Senegal | 5.0 /100 | #222 | Tragic 63.3% |
| Immigrants | Costa Rica | 4.5 /100 | #223 | Tragic 63.2% |
| Sub-Saharan Africans | 4.4 /100 | #224 | Tragic 63.2% |
| Immigrants | Peru | 4.0 /100 | #225 | Tragic 63.1% |
Demographics Similar to Immigrants from Lithuania by College, Under 1 year
In terms of college, under 1 year, the demographic groups most similar to Immigrants from Lithuania are Immigrants from Kuwait (70.3%, a difference of 0.050%), Israeli (70.2%, a difference of 0.070%), New Zealander (70.2%, a difference of 0.070%), Immigrants from Turkey (70.3%, a difference of 0.090%), and Immigrants from Norway (70.2%, a difference of 0.090%).
| Demographics | Rating | Rank | College, Under 1 year |
| Russians | 99.9 /100 | #35 | Exceptional 70.5% |
| Immigrants | Sri Lanka | 99.9 /100 | #36 | Exceptional 70.5% |
| Immigrants | Saudi Arabia | 99.9 /100 | #37 | Exceptional 70.4% |
| Australians | 99.9 /100 | #38 | Exceptional 70.4% |
| Bhutanese | 99.9 /100 | #39 | Exceptional 70.3% |
| Immigrants | Turkey | 99.9 /100 | #40 | Exceptional 70.3% |
| Immigrants | Kuwait | 99.9 /100 | #41 | Exceptional 70.3% |
| Immigrants | Lithuania | 99.9 /100 | #42 | Exceptional 70.3% |
| Israelis | 99.9 /100 | #43 | Exceptional 70.2% |
| New Zealanders | 99.9 /100 | #44 | Exceptional 70.2% |
| Immigrants | Norway | 99.9 /100 | #45 | Exceptional 70.2% |
| Immigrants | Latvia | 99.9 /100 | #46 | Exceptional 70.1% |
| Immigrants | Bulgaria | 99.8 /100 | #47 | Exceptional 70.0% |
| Immigrants | Netherlands | 99.8 /100 | #48 | Exceptional 70.0% |
| Immigrants | Austria | 99.8 /100 | #49 | Exceptional 70.0% |