Immigrants from Nigeria vs Slovak 6th Grade
COMPARE
Immigrants from Nigeria
Slovak
6th Grade
6th Grade Comparison
Immigrants from Nigeria
Slovaks
96.4%
6TH GRADE
0.3/ 100
METRIC RATING
262nd/ 347
METRIC RANK
98.2%
6TH GRADE
100.0/ 100
METRIC RATING
8th/ 347
METRIC RANK
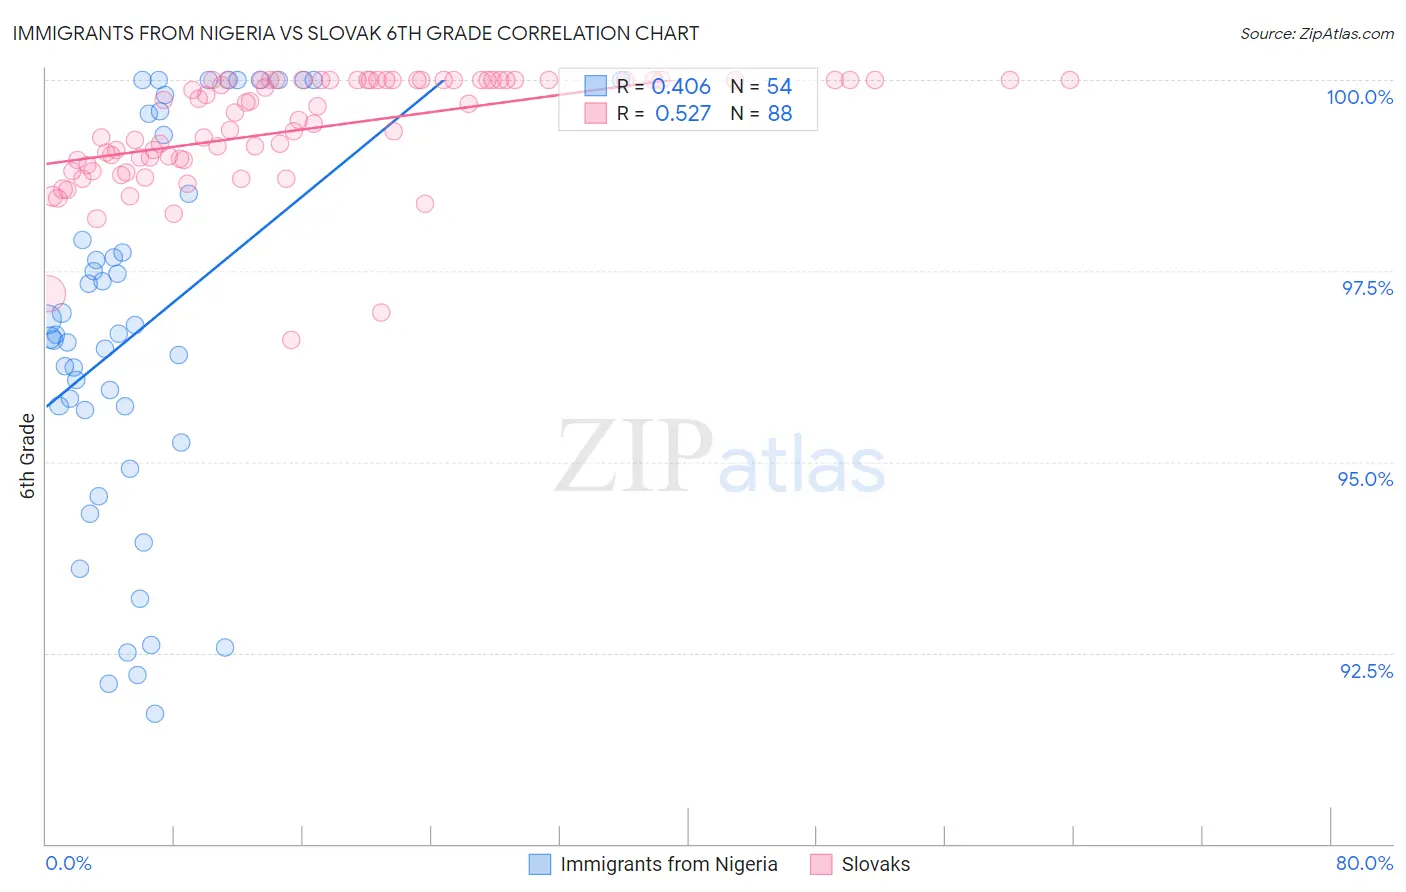
Immigrants from Nigeria vs Slovak 6th Grade Correlation Chart
The statistical analysis conducted on geographies consisting of 283,430,369 people shows a moderate positive correlation between the proportion of Immigrants from Nigeria and percentage of population with at least 6th grade education in the United States with a correlation coefficient (R) of 0.406 and weighted average of 96.4%. Similarly, the statistical analysis conducted on geographies consisting of 397,890,986 people shows a substantial positive correlation between the proportion of Slovaks and percentage of population with at least 6th grade education in the United States with a correlation coefficient (R) of 0.527 and weighted average of 98.2%, a difference of 1.9%.
6th Grade Correlation Summary
| Measurement | Immigrants from Nigeria | Slovak |
| Minimum | 91.7% | 96.6% |
| Maximum | 100.0% | 100.0% |
| Range | 8.3% | 3.4% |
| Mean | 96.8% | 99.4% |
| Median | 96.7% | 99.6% |
| Interquartile 25% (IQ1) | 95.7% | 99.0% |
| Interquartile 75% (IQ3) | 99.3% | 100.0% |
| Interquartile Range (IQR) | 3.6% | 1.0% |
| Standard Deviation (Sample) | 2.5% | 0.73% |
| Standard Deviation (Population) | 2.4% | 0.73% |
Similar Demographics by 6th Grade
Demographics Similar to Immigrants from Nigeria by 6th Grade
In terms of 6th grade, the demographic groups most similar to Immigrants from Nigeria are Immigrants from Colombia (96.4%, a difference of 0.010%), Armenian (96.4%, a difference of 0.020%), Immigrants from Jamaica (96.4%, a difference of 0.020%), Ghanaian (96.4%, a difference of 0.030%), and Afghan (96.4%, a difference of 0.030%).
| Demographics | Rating | Rank | 6th Grade |
| Immigrants | Congo | 0.6 /100 | #255 | Tragic 96.5% |
| U.S. Virgin Islanders | 0.5 /100 | #256 | Tragic 96.5% |
| Taiwanese | 0.5 /100 | #257 | Tragic 96.5% |
| Immigrants | China | 0.4 /100 | #258 | Tragic 96.4% |
| South Americans | 0.4 /100 | #259 | Tragic 96.4% |
| Peruvians | 0.4 /100 | #260 | Tragic 96.4% |
| Immigrants | Sierra Leone | 0.4 /100 | #261 | Tragic 96.4% |
| Immigrants | Nigeria | 0.3 /100 | #262 | Tragic 96.4% |
| Immigrants | Colombia | 0.3 /100 | #263 | Tragic 96.4% |
| Armenians | 0.3 /100 | #264 | Tragic 96.4% |
| Immigrants | Jamaica | 0.2 /100 | #265 | Tragic 96.4% |
| Ghanaians | 0.2 /100 | #266 | Tragic 96.4% |
| Afghans | 0.2 /100 | #267 | Tragic 96.4% |
| Immigrants | Uzbekistan | 0.2 /100 | #268 | Tragic 96.3% |
| West Indians | 0.2 /100 | #269 | Tragic 96.3% |
Demographics Similar to Slovaks by 6th Grade
In terms of 6th grade, the demographic groups most similar to Slovaks are German (98.2%, a difference of 0.0%), Norwegian (98.3%, a difference of 0.040%), Tsimshian (98.3%, a difference of 0.050%), Slovene (98.2%, a difference of 0.050%), and Swedish (98.2%, a difference of 0.080%).
| Demographics | Rating | Rank | 6th Grade |
| Crow | 100.0 /100 | #1 | Exceptional 99.4% |
| Ottawa | 100.0 /100 | #2 | Exceptional 98.5% |
| Welsh | 100.0 /100 | #3 | Exceptional 98.5% |
| Dutch | 100.0 /100 | #4 | Exceptional 98.4% |
| Tsimshian | 100.0 /100 | #5 | Exceptional 98.3% |
| Norwegians | 100.0 /100 | #6 | Exceptional 98.3% |
| Germans | 100.0 /100 | #7 | Exceptional 98.2% |
| Slovaks | 100.0 /100 | #8 | Exceptional 98.2% |
| Slovenes | 100.0 /100 | #9 | Exceptional 98.2% |
| Swedes | 100.0 /100 | #10 | Exceptional 98.2% |
| English | 100.0 /100 | #11 | Exceptional 98.1% |
| Alaskan Athabascans | 100.0 /100 | #12 | Exceptional 98.1% |
| Tlingit-Haida | 100.0 /100 | #13 | Exceptional 98.1% |
| Carpatho Rusyns | 100.0 /100 | #14 | Exceptional 98.1% |
| Inupiat | 100.0 /100 | #15 | Exceptional 98.1% |