Immigrants from Nigeria vs Slovak Family Households with Children
COMPARE
Immigrants from Nigeria
Slovak
Family Households with Children
Family Households with Children Comparison
Immigrants from Nigeria
Slovaks
28.6%
FAMILY HOUSEHOLDS WITH CHILDREN
100.0/ 100
METRIC RATING
59th/ 347
METRIC RANK
25.7%
FAMILY HOUSEHOLDS WITH CHILDREN
0.0/ 100
METRIC RATING
334th/ 347
METRIC RANK
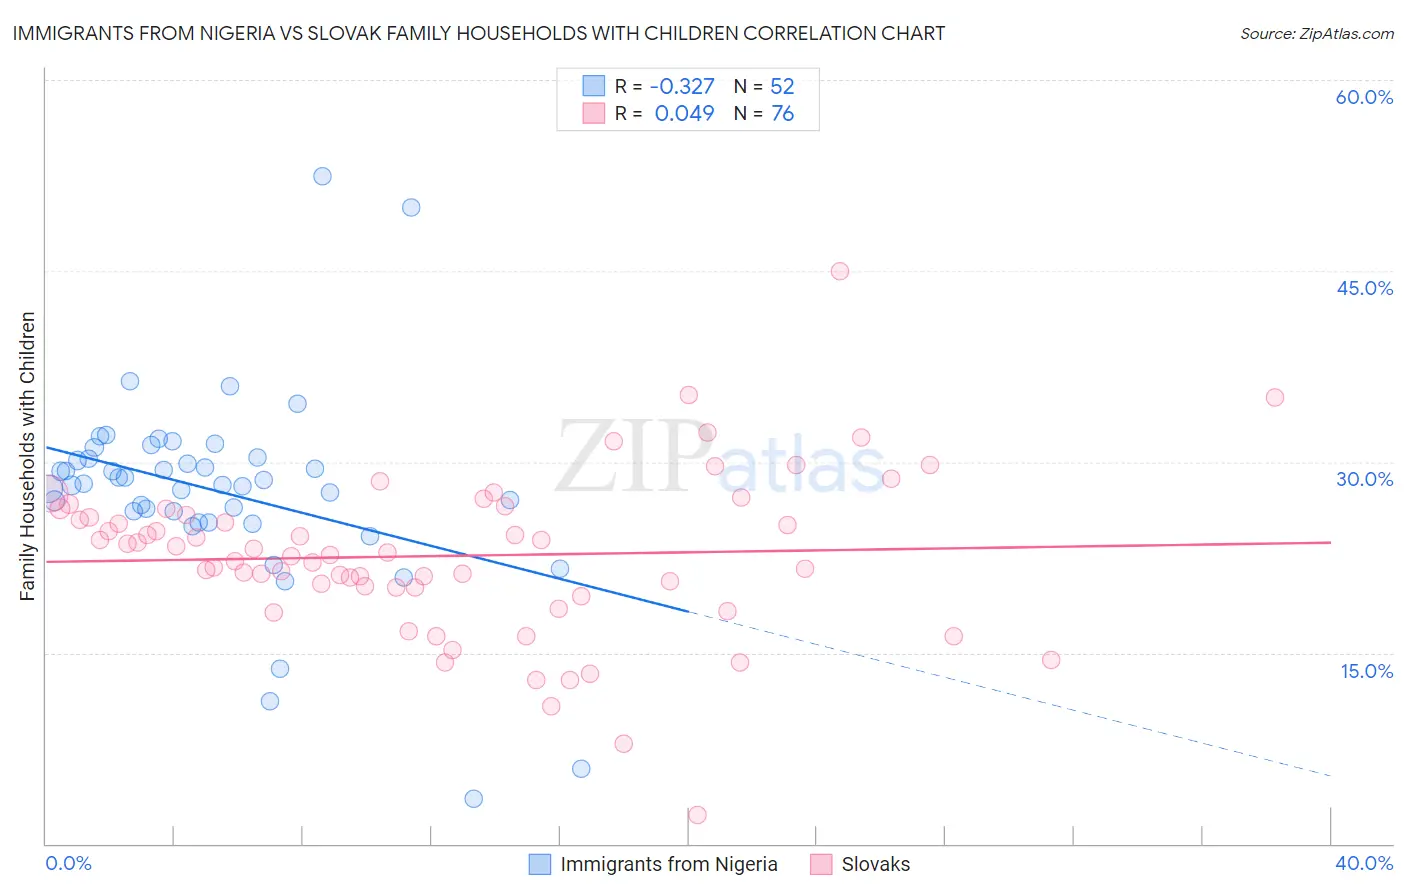
Immigrants from Nigeria vs Slovak Family Households with Children Correlation Chart
The statistical analysis conducted on geographies consisting of 283,169,059 people shows a mild negative correlation between the proportion of Immigrants from Nigeria and percentage of family households with children in the United States with a correlation coefficient (R) of -0.327 and weighted average of 28.6%. Similarly, the statistical analysis conducted on geographies consisting of 397,479,413 people shows no correlation between the proportion of Slovaks and percentage of family households with children in the United States with a correlation coefficient (R) of 0.049 and weighted average of 25.7%, a difference of 11.3%.
Family Households with Children Correlation Summary
| Measurement | Immigrants from Nigeria | Slovak |
| Minimum | 3.6% | 2.3% |
| Maximum | 52.5% | 45.0% |
| Range | 48.9% | 42.7% |
| Mean | 27.7% | 22.6% |
| Median | 28.2% | 22.8% |
| Interquartile 25% (IQ1) | 25.7% | 20.2% |
| Interquartile 75% (IQ3) | 30.3% | 26.1% |
| Interquartile Range (IQR) | 4.6% | 5.9% |
| Standard Deviation (Sample) | 7.9% | 6.4% |
| Standard Deviation (Population) | 7.8% | 6.4% |
Similar Demographics by Family Households with Children
Demographics Similar to Immigrants from Nigeria by Family Households with Children
In terms of family households with children, the demographic groups most similar to Immigrants from Nigeria are Hmong (28.6%, a difference of 0.060%), Immigrants from Ghana (28.6%, a difference of 0.13%), Egyptian (28.6%, a difference of 0.13%), Immigrants from Lebanon (28.6%, a difference of 0.14%), and Filipino (28.6%, a difference of 0.21%).
| Demographics | Rating | Rank | Family Households with Children |
| Guatemalans | 100.0 /100 | #52 | Exceptional 28.9% |
| Immigrants | Cambodia | 100.0 /100 | #53 | Exceptional 28.9% |
| Sierra Leoneans | 100.0 /100 | #54 | Exceptional 28.9% |
| Immigrants | Asia | 100.0 /100 | #55 | Exceptional 28.8% |
| Immigrants | Guatemala | 100.0 /100 | #56 | Exceptional 28.8% |
| Danes | 100.0 /100 | #57 | Exceptional 28.7% |
| Hawaiians | 100.0 /100 | #58 | Exceptional 28.7% |
| Immigrants | Nigeria | 100.0 /100 | #59 | Exceptional 28.6% |
| Hmong | 99.9 /100 | #60 | Exceptional 28.6% |
| Immigrants | Ghana | 99.9 /100 | #61 | Exceptional 28.6% |
| Egyptians | 99.9 /100 | #62 | Exceptional 28.6% |
| Immigrants | Lebanon | 99.9 /100 | #63 | Exceptional 28.6% |
| Filipinos | 99.9 /100 | #64 | Exceptional 28.6% |
| Hondurans | 99.9 /100 | #65 | Exceptional 28.5% |
| Immigrants | Egypt | 99.9 /100 | #66 | Exceptional 28.5% |
Demographics Similar to Slovaks by Family Households with Children
In terms of family households with children, the demographic groups most similar to Slovaks are Immigrants from Croatia (25.7%, a difference of 0.010%), Immigrants from West Indies (25.7%, a difference of 0.11%), Immigrants from Switzerland (25.7%, a difference of 0.15%), Immigrants from Austria (25.8%, a difference of 0.23%), and Slovene (25.8%, a difference of 0.45%).
| Demographics | Rating | Rank | Family Households with Children |
| Immigrants | Barbados | 0.0 /100 | #327 | Tragic 26.0% |
| Immigrants | Albania | 0.0 /100 | #328 | Tragic 25.9% |
| Cypriots | 0.0 /100 | #329 | Tragic 25.9% |
| Immigrants | Latvia | 0.0 /100 | #330 | Tragic 25.9% |
| Slovenes | 0.0 /100 | #331 | Tragic 25.8% |
| Immigrants | Austria | 0.0 /100 | #332 | Tragic 25.8% |
| Immigrants | Switzerland | 0.0 /100 | #333 | Tragic 25.7% |
| Slovaks | 0.0 /100 | #334 | Tragic 25.7% |
| Immigrants | Croatia | 0.0 /100 | #335 | Tragic 25.7% |
| Immigrants | West Indies | 0.0 /100 | #336 | Tragic 25.7% |
| Puerto Ricans | 0.0 /100 | #337 | Tragic 25.6% |
| Arapaho | 0.0 /100 | #338 | Tragic 25.6% |
| Immigrants | St. Vincent and the Grenadines | 0.0 /100 | #339 | Tragic 25.6% |
| Immigrants | Armenia | 0.0 /100 | #340 | Tragic 25.6% |
| Immigrants | Serbia | 0.0 /100 | #341 | Tragic 25.5% |