Immigrants from Nigeria vs Immigrants from Poland College, Under 1 year
COMPARE
Immigrants from Nigeria
Immigrants from Poland
College, Under 1 year
College, Under 1 year Comparison
Immigrants from Nigeria
Immigrants from Poland
63.7%
COLLEGE, UNDER 1 YEAR
8.8/ 100
METRIC RATING
214th/ 347
METRIC RANK
65.2%
COLLEGE, UNDER 1 YEAR
42.6/ 100
METRIC RATING
183rd/ 347
METRIC RANK
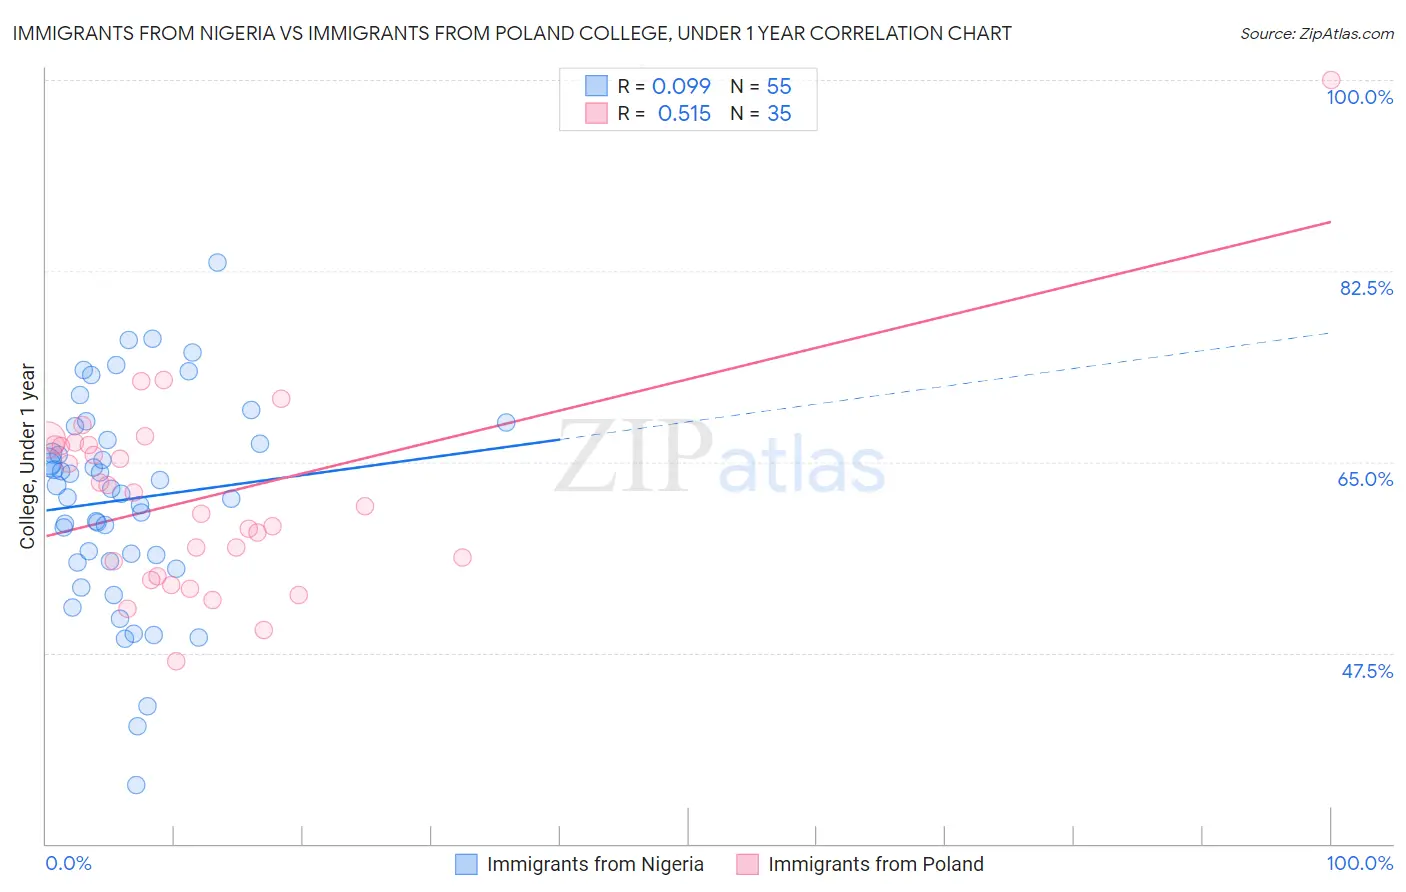
Immigrants from Nigeria vs Immigrants from Poland College, Under 1 year Correlation Chart
The statistical analysis conducted on geographies consisting of 283,490,343 people shows a slight positive correlation between the proportion of Immigrants from Nigeria and percentage of population with at least college, under 1 year education in the United States with a correlation coefficient (R) of 0.099 and weighted average of 63.7%. Similarly, the statistical analysis conducted on geographies consisting of 304,861,877 people shows a substantial positive correlation between the proportion of Immigrants from Poland and percentage of population with at least college, under 1 year education in the United States with a correlation coefficient (R) of 0.515 and weighted average of 65.2%, a difference of 2.3%.
College, Under 1 year Correlation Summary
| Measurement | Immigrants from Nigeria | Immigrants from Poland |
| Minimum | 35.4% | 46.7% |
| Maximum | 83.3% | 100.0% |
| Range | 47.9% | 53.3% |
| Mean | 61.5% | 61.8% |
| Median | 62.6% | 61.0% |
| Interquartile 25% (IQ1) | 55.9% | 54.6% |
| Interquartile 75% (IQ3) | 67.0% | 66.6% |
| Interquartile Range (IQR) | 11.0% | 12.0% |
| Standard Deviation (Sample) | 9.4% | 9.4% |
| Standard Deviation (Population) | 9.3% | 9.3% |
Similar Demographics by College, Under 1 year
Demographics Similar to Immigrants from Nigeria by College, Under 1 year
In terms of college, under 1 year, the demographic groups most similar to Immigrants from Nigeria are Immigrants from South America (63.8%, a difference of 0.040%), Senegalese (63.6%, a difference of 0.17%), Immigrants from Middle Africa (63.9%, a difference of 0.22%), Native Hawaiian (63.9%, a difference of 0.23%), and Ghanaian (63.9%, a difference of 0.30%).
| Demographics | Rating | Rank | College, Under 1 year |
| Colombians | 12.4 /100 | #207 | Poor 64.0% |
| Immigrants | Vietnam | 12.1 /100 | #208 | Poor 64.0% |
| Puget Sound Salish | 11.3 /100 | #209 | Poor 63.9% |
| Ghanaians | 11.2 /100 | #210 | Poor 63.9% |
| Native Hawaiians | 10.6 /100 | #211 | Poor 63.9% |
| Immigrants | Middle Africa | 10.5 /100 | #212 | Poor 63.9% |
| Immigrants | South America | 9.1 /100 | #213 | Tragic 63.8% |
| Immigrants | Nigeria | 8.8 /100 | #214 | Tragic 63.7% |
| Senegalese | 7.7 /100 | #215 | Tragic 63.6% |
| Hmong | 6.8 /100 | #216 | Tragic 63.5% |
| Immigrants | Uruguay | 5.8 /100 | #217 | Tragic 63.4% |
| Immigrants | Panama | 5.7 /100 | #218 | Tragic 63.4% |
| Immigrants | Fiji | 5.7 /100 | #219 | Tragic 63.4% |
| Portuguese | 5.6 /100 | #220 | Tragic 63.4% |
| Cree | 5.2 /100 | #221 | Tragic 63.3% |
Demographics Similar to Immigrants from Poland by College, Under 1 year
In terms of college, under 1 year, the demographic groups most similar to Immigrants from Poland are Bermudan (65.2%, a difference of 0.030%), Sri Lankan (65.2%, a difference of 0.040%), Immigrants from Africa (65.3%, a difference of 0.10%), Spaniard (65.3%, a difference of 0.13%), and Immigrants from Sierra Leone (65.1%, a difference of 0.13%).
| Demographics | Rating | Rank | College, Under 1 year |
| French | 48.9 /100 | #176 | Average 65.4% |
| Immigrants | North Macedonia | 48.6 /100 | #177 | Average 65.4% |
| German Russians | 48.3 /100 | #178 | Average 65.4% |
| Guamanians/Chamorros | 48.2 /100 | #179 | Average 65.4% |
| Dutch | 46.1 /100 | #180 | Average 65.3% |
| Spaniards | 45.5 /100 | #181 | Average 65.3% |
| Immigrants | Africa | 44.7 /100 | #182 | Average 65.3% |
| Immigrants | Poland | 42.6 /100 | #183 | Average 65.2% |
| Bermudans | 42.0 /100 | #184 | Average 65.2% |
| Sri Lankans | 41.7 /100 | #185 | Average 65.2% |
| Immigrants | Sierra Leone | 39.7 /100 | #186 | Fair 65.1% |
| Immigrants | Southern Europe | 34.3 /100 | #187 | Fair 64.9% |
| Immigrants | Albania | 32.0 /100 | #188 | Fair 64.9% |
| Spanish | 31.6 /100 | #189 | Fair 64.9% |
| Immigrants | Philippines | 30.1 /100 | #190 | Fair 64.8% |