Immigrants from Nigeria vs Immigrants from Australia College, Under 1 year
COMPARE
Immigrants from Nigeria
Immigrants from Australia
College, Under 1 year
College, Under 1 year Comparison
Immigrants from Nigeria
Immigrants from Australia
63.7%
COLLEGE, UNDER 1 YEAR
8.8/ 100
METRIC RATING
214th/ 347
METRIC RANK
72.7%
COLLEGE, UNDER 1 YEAR
100.0/ 100
METRIC RATING
9th/ 347
METRIC RANK
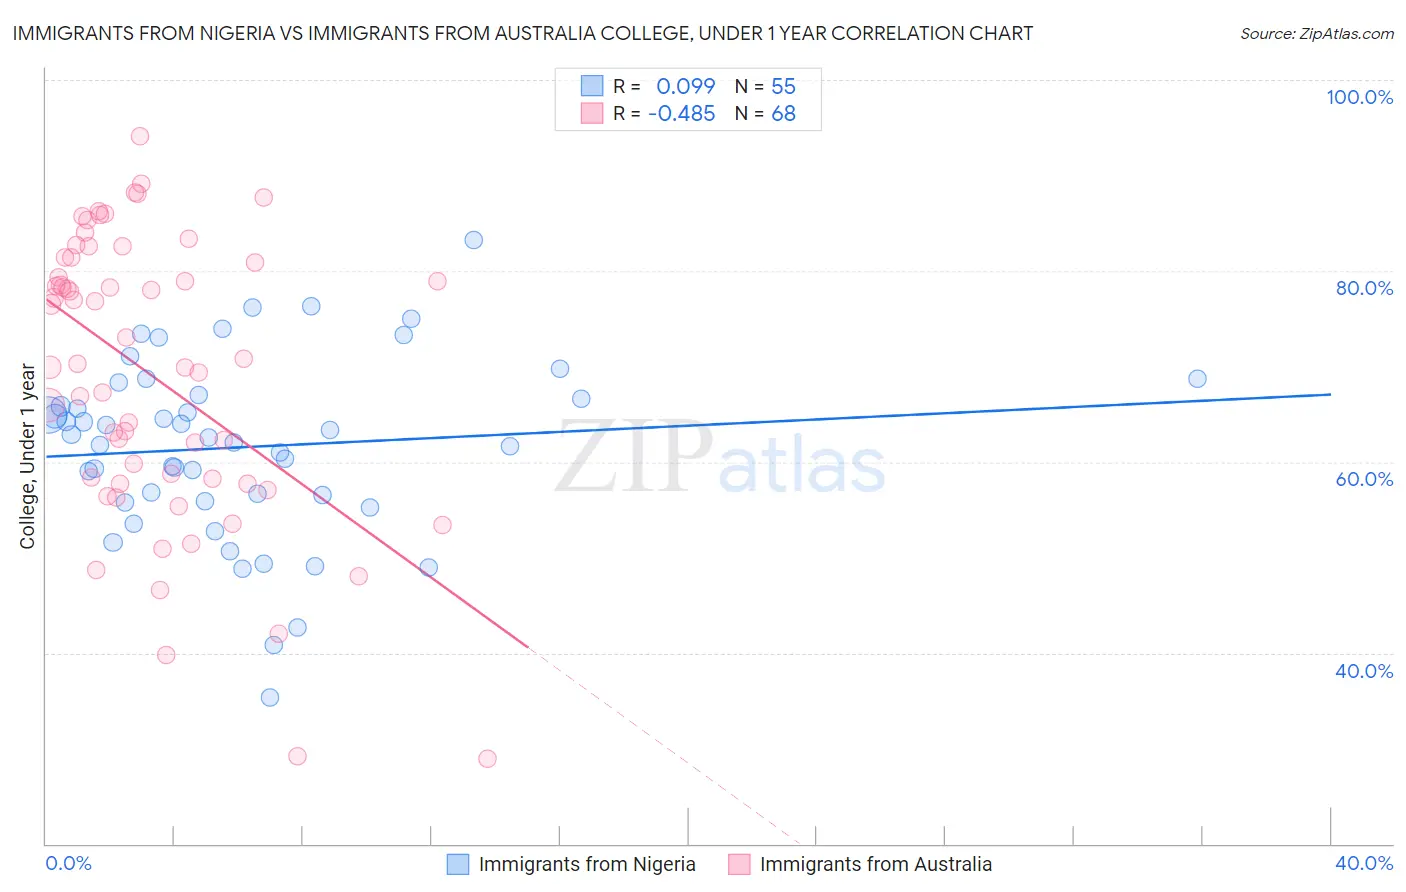
Immigrants from Nigeria vs Immigrants from Australia College, Under 1 year Correlation Chart
The statistical analysis conducted on geographies consisting of 283,490,343 people shows a slight positive correlation between the proportion of Immigrants from Nigeria and percentage of population with at least college, under 1 year education in the United States with a correlation coefficient (R) of 0.099 and weighted average of 63.7%. Similarly, the statistical analysis conducted on geographies consisting of 227,203,336 people shows a moderate negative correlation between the proportion of Immigrants from Australia and percentage of population with at least college, under 1 year education in the United States with a correlation coefficient (R) of -0.485 and weighted average of 72.7%, a difference of 14.1%.
College, Under 1 year Correlation Summary
| Measurement | Immigrants from Nigeria | Immigrants from Australia |
| Minimum | 35.4% | 28.9% |
| Maximum | 83.3% | 94.1% |
| Range | 47.9% | 65.1% |
| Mean | 61.5% | 69.1% |
| Median | 62.6% | 70.6% |
| Interquartile 25% (IQ1) | 55.9% | 57.9% |
| Interquartile 75% (IQ3) | 67.0% | 81.1% |
| Interquartile Range (IQR) | 11.0% | 23.2% |
| Standard Deviation (Sample) | 9.4% | 14.9% |
| Standard Deviation (Population) | 9.3% | 14.8% |
Similar Demographics by College, Under 1 year
Demographics Similar to Immigrants from Nigeria by College, Under 1 year
In terms of college, under 1 year, the demographic groups most similar to Immigrants from Nigeria are Immigrants from South America (63.8%, a difference of 0.040%), Senegalese (63.6%, a difference of 0.17%), Immigrants from Middle Africa (63.9%, a difference of 0.22%), Native Hawaiian (63.9%, a difference of 0.23%), and Ghanaian (63.9%, a difference of 0.30%).
| Demographics | Rating | Rank | College, Under 1 year |
| Colombians | 12.4 /100 | #207 | Poor 64.0% |
| Immigrants | Vietnam | 12.1 /100 | #208 | Poor 64.0% |
| Puget Sound Salish | 11.3 /100 | #209 | Poor 63.9% |
| Ghanaians | 11.2 /100 | #210 | Poor 63.9% |
| Native Hawaiians | 10.6 /100 | #211 | Poor 63.9% |
| Immigrants | Middle Africa | 10.5 /100 | #212 | Poor 63.9% |
| Immigrants | South America | 9.1 /100 | #213 | Tragic 63.8% |
| Immigrants | Nigeria | 8.8 /100 | #214 | Tragic 63.7% |
| Senegalese | 7.7 /100 | #215 | Tragic 63.6% |
| Hmong | 6.8 /100 | #216 | Tragic 63.5% |
| Immigrants | Uruguay | 5.8 /100 | #217 | Tragic 63.4% |
| Immigrants | Panama | 5.7 /100 | #218 | Tragic 63.4% |
| Immigrants | Fiji | 5.7 /100 | #219 | Tragic 63.4% |
| Portuguese | 5.6 /100 | #220 | Tragic 63.4% |
| Cree | 5.2 /100 | #221 | Tragic 63.3% |
Demographics Similar to Immigrants from Australia by College, Under 1 year
In terms of college, under 1 year, the demographic groups most similar to Immigrants from Australia are Immigrants from Israel (72.3%, a difference of 0.62%), Immigrants from South Central Asia (72.1%, a difference of 0.92%), Immigrants from Sweden (72.1%, a difference of 0.93%), Thai (73.4%, a difference of 0.95%), and Cypriot (72.0%, a difference of 1.1%).
| Demographics | Rating | Rank | College, Under 1 year |
| Iranians | 100.0 /100 | #2 | Exceptional 74.9% |
| Immigrants | Singapore | 100.0 /100 | #3 | Exceptional 74.8% |
| Immigrants | India | 100.0 /100 | #4 | Exceptional 74.4% |
| Immigrants | Iran | 100.0 /100 | #5 | Exceptional 74.3% |
| Immigrants | Taiwan | 100.0 /100 | #6 | Exceptional 74.2% |
| Okinawans | 100.0 /100 | #7 | Exceptional 73.7% |
| Thais | 100.0 /100 | #8 | Exceptional 73.4% |
| Immigrants | Australia | 100.0 /100 | #9 | Exceptional 72.7% |
| Immigrants | Israel | 100.0 /100 | #10 | Exceptional 72.3% |
| Immigrants | South Central Asia | 100.0 /100 | #11 | Exceptional 72.1% |
| Immigrants | Sweden | 100.0 /100 | #12 | Exceptional 72.1% |
| Cypriots | 100.0 /100 | #13 | Exceptional 72.0% |
| Cambodians | 100.0 /100 | #14 | Exceptional 71.9% |
| Burmese | 100.0 /100 | #15 | Exceptional 71.9% |
| Immigrants | Japan | 100.0 /100 | #16 | Exceptional 71.9% |