Immigrants from Nigeria vs Slovak No Schooling Completed
COMPARE
Immigrants from Nigeria
Slovak
No Schooling Completed
No Schooling Completed Comparison
Immigrants from Nigeria
Slovaks
2.5%
NO SCHOOLING COMPLETED
0.2/ 100
METRIC RATING
269th/ 347
METRIC RANK
1.3%
NO SCHOOLING COMPLETED
100.0/ 100
METRIC RATING
2nd/ 347
METRIC RANK
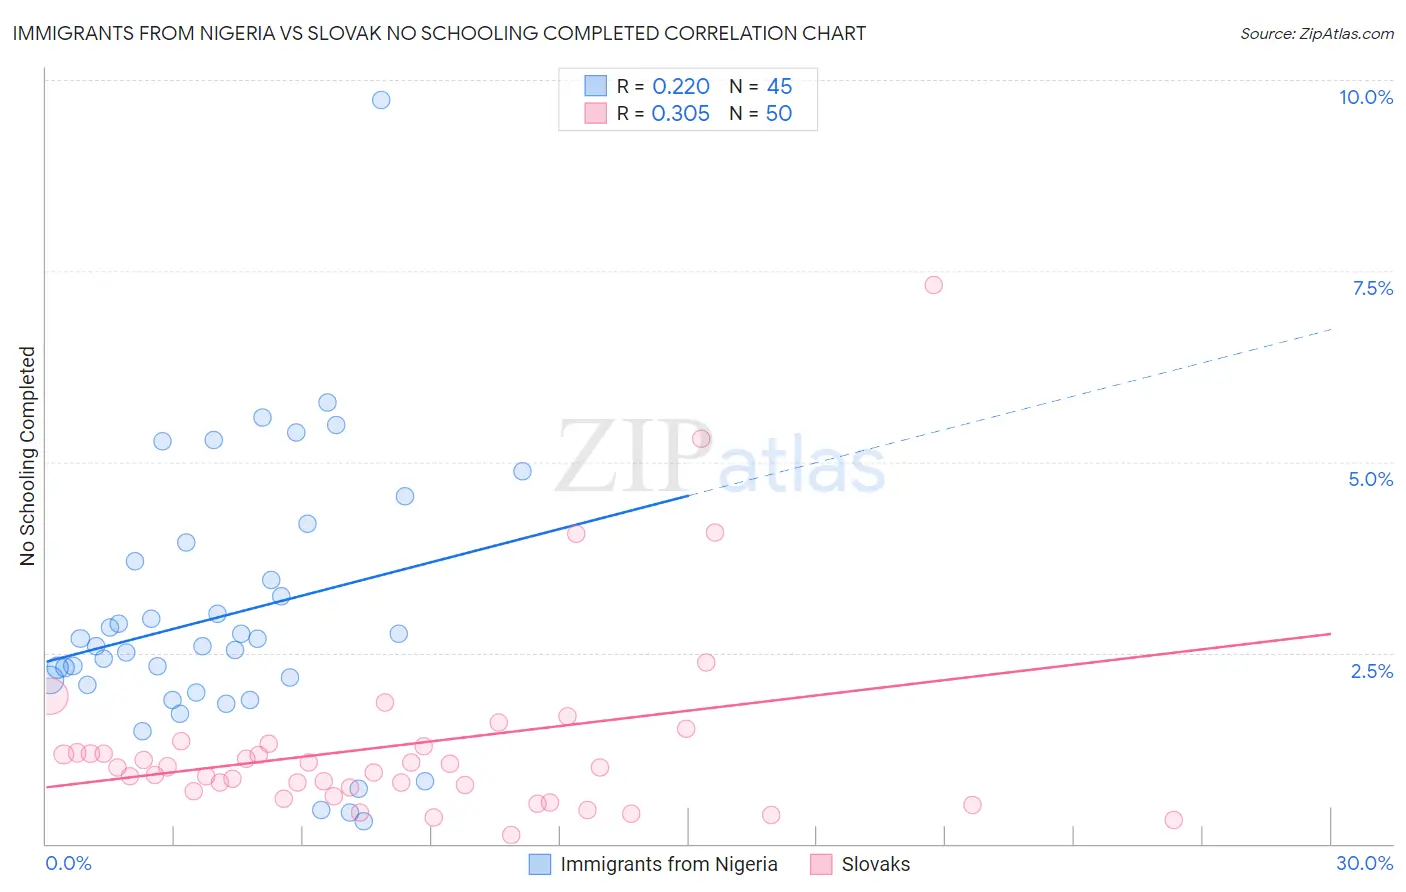
Immigrants from Nigeria vs Slovak No Schooling Completed Correlation Chart
The statistical analysis conducted on geographies consisting of 282,263,250 people shows a weak positive correlation between the proportion of Immigrants from Nigeria and percentage of population with no schooling in the United States with a correlation coefficient (R) of 0.220 and weighted average of 2.5%. Similarly, the statistical analysis conducted on geographies consisting of 391,654,464 people shows a mild positive correlation between the proportion of Slovaks and percentage of population with no schooling in the United States with a correlation coefficient (R) of 0.305 and weighted average of 1.3%, a difference of 87.2%.
No Schooling Completed Correlation Summary
| Measurement | Immigrants from Nigeria | Slovak |
| Minimum | 0.30% | 0.11% |
| Maximum | 9.7% | 7.3% |
| Range | 9.4% | 7.2% |
| Mean | 3.0% | 1.3% |
| Median | 2.6% | 1.00% |
| Interquartile 25% (IQ1) | 2.0% | 0.70% |
| Interquartile 75% (IQ3) | 3.8% | 1.3% |
| Interquartile Range (IQR) | 1.8% | 0.59% |
| Standard Deviation (Sample) | 1.8% | 1.3% |
| Standard Deviation (Population) | 1.7% | 1.3% |
Similar Demographics by No Schooling Completed
Demographics Similar to Immigrants from Nigeria by No Schooling Completed
In terms of no schooling completed, the demographic groups most similar to Immigrants from Nigeria are Immigrants from Peru (2.5%, a difference of 0.080%), Cuban (2.5%, a difference of 0.090%), Immigrants from Bolivia (2.5%, a difference of 0.62%), Taiwanese (2.5%, a difference of 0.86%), and Yuman (2.5%, a difference of 1.1%).
| Demographics | Rating | Rank | No Schooling Completed |
| Immigrants | Sierra Leone | 0.5 /100 | #262 | Tragic 2.5% |
| Immigrants | Liberia | 0.4 /100 | #263 | Tragic 2.5% |
| Indians (Asian) | 0.4 /100 | #264 | Tragic 2.5% |
| West Indians | 0.4 /100 | #265 | Tragic 2.5% |
| Fijians | 0.4 /100 | #266 | Tragic 2.5% |
| Yuman | 0.4 /100 | #267 | Tragic 2.5% |
| Taiwanese | 0.3 /100 | #268 | Tragic 2.5% |
| Immigrants | Nigeria | 0.2 /100 | #269 | Tragic 2.5% |
| Immigrants | Peru | 0.2 /100 | #270 | Tragic 2.5% |
| Cubans | 0.2 /100 | #271 | Tragic 2.5% |
| Immigrants | Bolivia | 0.2 /100 | #272 | Tragic 2.5% |
| Immigrants | Cameroon | 0.1 /100 | #273 | Tragic 2.5% |
| Ghanaians | 0.1 /100 | #274 | Tragic 2.6% |
| Immigrants | China | 0.1 /100 | #275 | Tragic 2.6% |
| Immigrants | Western Africa | 0.1 /100 | #276 | Tragic 2.6% |
Demographics Similar to Slovaks by No Schooling Completed
In terms of no schooling completed, the demographic groups most similar to Slovaks are Norwegian (1.3%, a difference of 0.43%), German (1.4%, a difference of 0.99%), Slovene (1.4%, a difference of 1.4%), Carpatho Rusyn (1.4%, a difference of 2.2%), and English (1.4%, a difference of 3.2%).
| Demographics | Rating | Rank | No Schooling Completed |
| Yup'ik | 100.0 /100 | #1 | Exceptional 1.2% |
| Slovaks | 100.0 /100 | #2 | Exceptional 1.3% |
| Norwegians | 100.0 /100 | #3 | Exceptional 1.3% |
| Germans | 100.0 /100 | #4 | Exceptional 1.4% |
| Slovenes | 100.0 /100 | #5 | Exceptional 1.4% |
| Carpatho Rusyns | 100.0 /100 | #6 | Exceptional 1.4% |
| English | 100.0 /100 | #7 | Exceptional 1.4% |
| Swedes | 100.0 /100 | #8 | Exceptional 1.4% |
| Scottish | 100.0 /100 | #9 | Exceptional 1.4% |
| Dutch | 100.0 /100 | #10 | Exceptional 1.4% |
| Lithuanians | 100.0 /100 | #11 | Exceptional 1.4% |
| Irish | 100.0 /100 | #12 | Exceptional 1.4% |
| Poles | 100.0 /100 | #13 | Exceptional 1.4% |
| Scotch-Irish | 100.0 /100 | #14 | Exceptional 1.5% |
| Tlingit-Haida | 100.0 /100 | #15 | Exceptional 1.5% |