Immigrants from Netherlands vs Yugoslavian College, Under 1 year
COMPARE
Immigrants from Netherlands
Yugoslavian
College, Under 1 year
College, Under 1 year Comparison
Immigrants from Netherlands
Yugoslavians
70.0%
COLLEGE, UNDER 1 YEAR
99.8/ 100
METRIC RATING
48th/ 347
METRIC RANK
65.6%
COLLEGE, UNDER 1 YEAR
55.7/ 100
METRIC RATING
169th/ 347
METRIC RANK
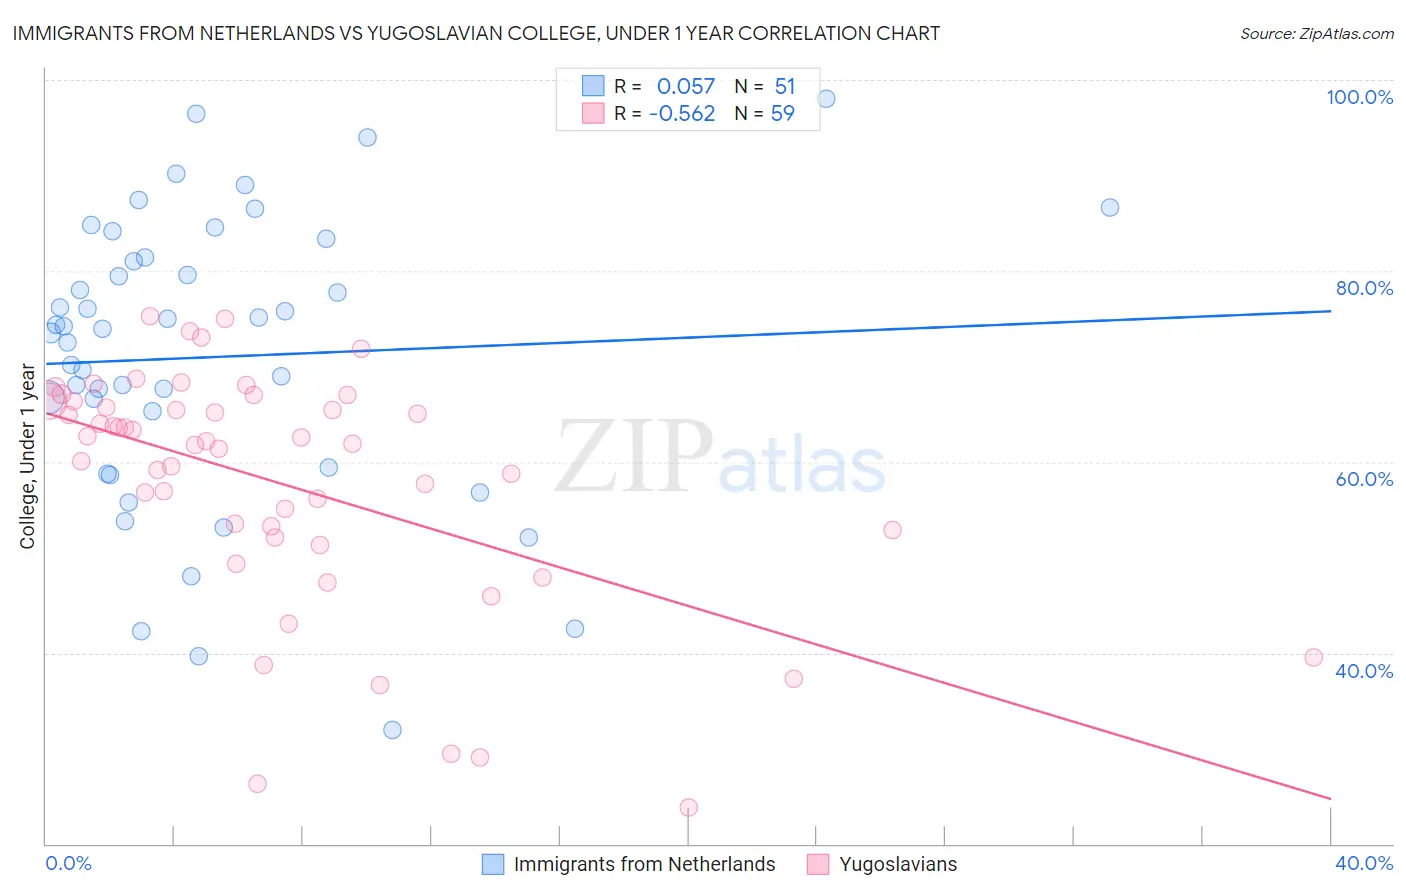
Immigrants from Netherlands vs Yugoslavian College, Under 1 year Correlation Chart
The statistical analysis conducted on geographies consisting of 237,877,405 people shows a slight positive correlation between the proportion of Immigrants from Netherlands and percentage of population with at least college, under 1 year education in the United States with a correlation coefficient (R) of 0.057 and weighted average of 70.0%. Similarly, the statistical analysis conducted on geographies consisting of 285,723,201 people shows a substantial negative correlation between the proportion of Yugoslavians and percentage of population with at least college, under 1 year education in the United States with a correlation coefficient (R) of -0.562 and weighted average of 65.6%, a difference of 6.8%.
College, Under 1 year Correlation Summary
| Measurement | Immigrants from Netherlands | Yugoslavian |
| Minimum | 32.0% | 23.8% |
| Maximum | 98.1% | 75.2% |
| Range | 66.1% | 51.5% |
| Mean | 71.0% | 57.7% |
| Median | 73.9% | 61.9% |
| Interquartile 25% (IQ1) | 59.4% | 52.1% |
| Interquartile 75% (IQ3) | 81.4% | 66.3% |
| Interquartile Range (IQR) | 22.0% | 14.2% |
| Standard Deviation (Sample) | 15.0% | 12.5% |
| Standard Deviation (Population) | 14.9% | 12.3% |
Similar Demographics by College, Under 1 year
Demographics Similar to Immigrants from Netherlands by College, Under 1 year
In terms of college, under 1 year, the demographic groups most similar to Immigrants from Netherlands are Immigrants from Austria (70.0%, a difference of 0.040%), Immigrants from Bulgaria (70.0%, a difference of 0.060%), Zimbabwean (69.9%, a difference of 0.16%), Immigrants from Latvia (70.1%, a difference of 0.17%), and Mongolian (69.9%, a difference of 0.20%).
| Demographics | Rating | Rank | College, Under 1 year |
| Immigrants | Kuwait | 99.9 /100 | #41 | Exceptional 70.3% |
| Immigrants | Lithuania | 99.9 /100 | #42 | Exceptional 70.3% |
| Israelis | 99.9 /100 | #43 | Exceptional 70.2% |
| New Zealanders | 99.9 /100 | #44 | Exceptional 70.2% |
| Immigrants | Norway | 99.9 /100 | #45 | Exceptional 70.2% |
| Immigrants | Latvia | 99.9 /100 | #46 | Exceptional 70.1% |
| Immigrants | Bulgaria | 99.8 /100 | #47 | Exceptional 70.0% |
| Immigrants | Netherlands | 99.8 /100 | #48 | Exceptional 70.0% |
| Immigrants | Austria | 99.8 /100 | #49 | Exceptional 70.0% |
| Zimbabweans | 99.8 /100 | #50 | Exceptional 69.9% |
| Mongolians | 99.8 /100 | #51 | Exceptional 69.9% |
| Immigrants | Russia | 99.8 /100 | #52 | Exceptional 69.9% |
| South Africans | 99.7 /100 | #53 | Exceptional 69.7% |
| Immigrants | Czechoslovakia | 99.7 /100 | #54 | Exceptional 69.6% |
| Maltese | 99.7 /100 | #55 | Exceptional 69.5% |
Demographics Similar to Yugoslavians by College, Under 1 year
In terms of college, under 1 year, the demographic groups most similar to Yugoslavians are German (65.6%, a difference of 0.0%), Hungarian (65.6%, a difference of 0.010%), Immigrants from Somalia (65.6%, a difference of 0.030%), Immigrants from Oceania (65.6%, a difference of 0.030%), and Moroccan (65.6%, a difference of 0.040%).
| Demographics | Rating | Rank | College, Under 1 year |
| Koreans | 65.3 /100 | #162 | Good 65.9% |
| Somalis | 62.7 /100 | #163 | Good 65.8% |
| Czechoslovakians | 62.6 /100 | #164 | Good 65.8% |
| Immigrants | Uzbekistan | 61.6 /100 | #165 | Good 65.8% |
| Moroccans | 56.7 /100 | #166 | Average 65.6% |
| Immigrants | Somalia | 56.4 /100 | #167 | Average 65.6% |
| Hungarians | 55.9 /100 | #168 | Average 65.6% |
| Yugoslavians | 55.7 /100 | #169 | Average 65.6% |
| Germans | 55.7 /100 | #170 | Average 65.6% |
| Immigrants | Oceania | 55.0 /100 | #171 | Average 65.6% |
| South American Indians | 54.4 /100 | #172 | Average 65.5% |
| Swiss | 53.9 /100 | #173 | Average 65.5% |
| Immigrants | Bosnia and Herzegovina | 50.0 /100 | #174 | Average 65.4% |
| Scotch-Irish | 49.5 /100 | #175 | Average 65.4% |
| French | 48.9 /100 | #176 | Average 65.4% |