Immigrants from Netherlands vs Potawatomi 4 or more Vehicles in Household
COMPARE
Immigrants from Netherlands
Potawatomi
4 or more Vehicles in Household
4 or more Vehicles in Household Comparison
Immigrants from Netherlands
Potawatomi
6.6%
4 OR MORE VEHICLES IN HOUSEHOLD
87.8/ 100
METRIC RATING
132nd/ 347
METRIC RANK
7.3%
4 OR MORE VEHICLES IN HOUSEHOLD
99.7/ 100
METRIC RATING
83rd/ 347
METRIC RANK
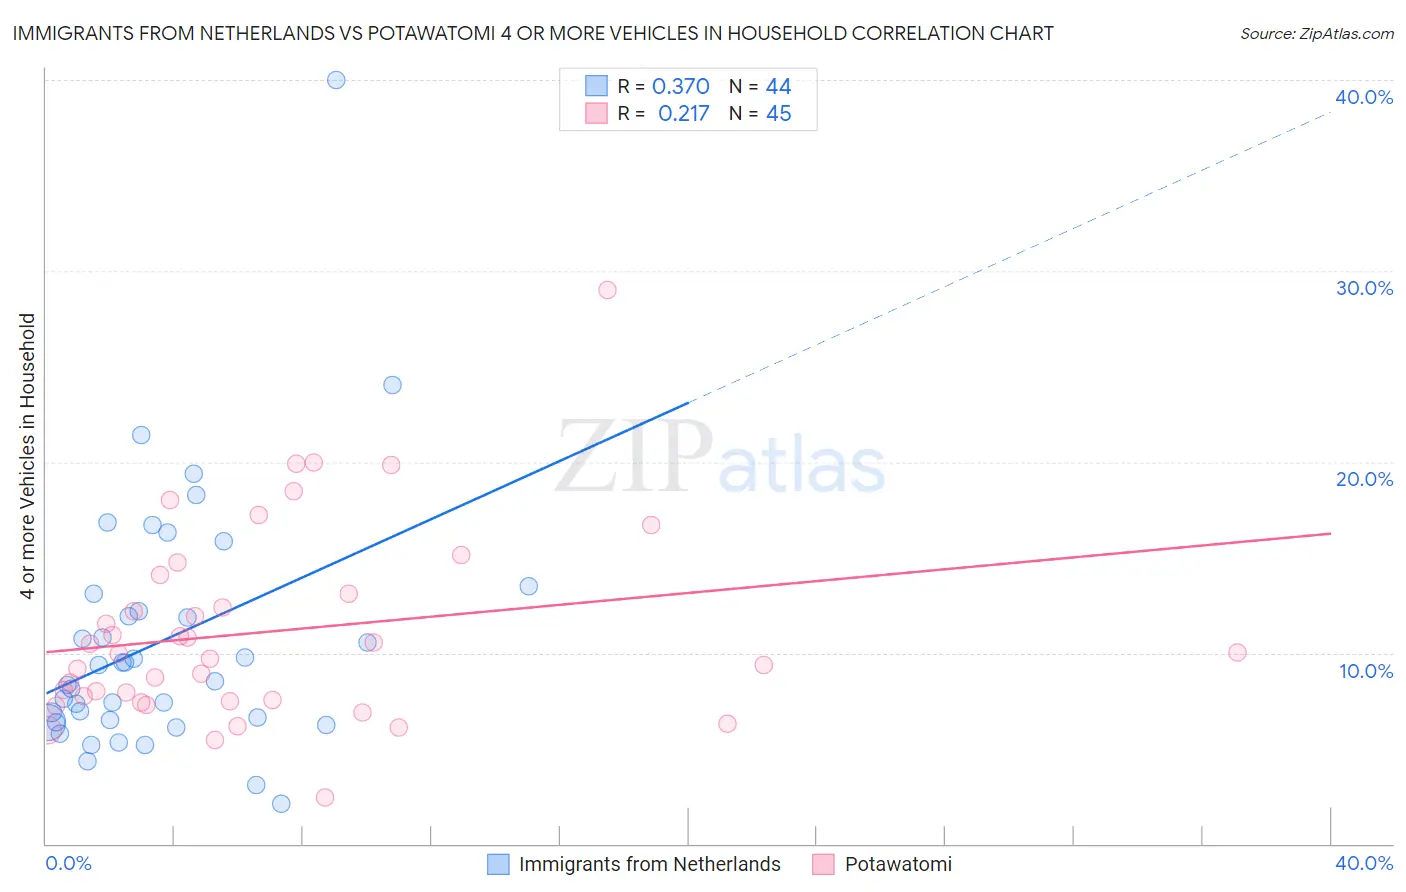
Immigrants from Netherlands vs Potawatomi 4 or more Vehicles in Household Correlation Chart
The statistical analysis conducted on geographies consisting of 237,226,549 people shows a mild positive correlation between the proportion of Immigrants from Netherlands and percentage of households with 4 or more vehicles available in the United States with a correlation coefficient (R) of 0.370 and weighted average of 6.6%. Similarly, the statistical analysis conducted on geographies consisting of 117,653,043 people shows a weak positive correlation between the proportion of Potawatomi and percentage of households with 4 or more vehicles available in the United States with a correlation coefficient (R) of 0.217 and weighted average of 7.3%, a difference of 9.6%.
4 or more Vehicles in Household Correlation Summary
| Measurement | Immigrants from Netherlands | Potawatomi |
| Minimum | 2.1% | 2.4% |
| Maximum | 40.0% | 29.0% |
| Range | 37.9% | 26.6% |
| Mean | 10.6% | 11.1% |
| Median | 8.9% | 10.0% |
| Interquartile 25% (IQ1) | 6.4% | 7.5% |
| Interquartile 75% (IQ3) | 12.6% | 13.6% |
| Interquartile Range (IQR) | 6.2% | 6.1% |
| Standard Deviation (Sample) | 6.7% | 5.1% |
| Standard Deviation (Population) | 6.6% | 5.0% |
Similar Demographics by 4 or more Vehicles in Household
Demographics Similar to Immigrants from Netherlands by 4 or more Vehicles in Household
In terms of 4 or more vehicles in household, the demographic groups most similar to Immigrants from Netherlands are Maltese (6.7%, a difference of 0.14%), Armenian (6.6%, a difference of 0.19%), Ottawa (6.6%, a difference of 0.21%), Tohono O'odham (6.6%, a difference of 0.24%), and Immigrants from Scotland (6.7%, a difference of 0.29%).
| Demographics | Rating | Rank | 4 or more Vehicles in Household |
| Austrians | 94.1 /100 | #125 | Exceptional 6.8% |
| Belgians | 94.1 /100 | #126 | Exceptional 6.8% |
| Immigrants | Korea | 93.8 /100 | #127 | Exceptional 6.8% |
| Immigrants | Bolivia | 92.5 /100 | #128 | Exceptional 6.7% |
| Immigrants | England | 92.0 /100 | #129 | Exceptional 6.7% |
| Immigrants | Scotland | 89.0 /100 | #130 | Excellent 6.7% |
| Maltese | 88.4 /100 | #131 | Excellent 6.7% |
| Immigrants | Netherlands | 87.8 /100 | #132 | Excellent 6.6% |
| Armenians | 86.9 /100 | #133 | Excellent 6.6% |
| Ottawa | 86.9 /100 | #134 | Excellent 6.6% |
| Tohono O'odham | 86.7 /100 | #135 | Excellent 6.6% |
| Luxembourgers | 86.4 /100 | #136 | Excellent 6.6% |
| French Canadians | 85.4 /100 | #137 | Excellent 6.6% |
| Italians | 84.5 /100 | #138 | Excellent 6.6% |
| Jordanians | 82.1 /100 | #139 | Excellent 6.6% |
Demographics Similar to Potawatomi by 4 or more Vehicles in Household
In terms of 4 or more vehicles in household, the demographic groups most similar to Potawatomi are Northern European (7.3%, a difference of 0.12%), Finnish (7.3%, a difference of 0.32%), Afghan (7.3%, a difference of 0.33%), Cree (7.2%, a difference of 0.49%), and Immigrants from Indonesia (7.2%, a difference of 0.68%).
| Demographics | Rating | Rank | 4 or more Vehicles in Household |
| Laotians | 99.9 /100 | #76 | Exceptional 7.4% |
| Apache | 99.9 /100 | #77 | Exceptional 7.4% |
| Whites/Caucasians | 99.8 /100 | #78 | Exceptional 7.4% |
| Czechs | 99.8 /100 | #79 | Exceptional 7.4% |
| Alaska Natives | 99.8 /100 | #80 | Exceptional 7.3% |
| Finns | 99.8 /100 | #81 | Exceptional 7.3% |
| Northern Europeans | 99.8 /100 | #82 | Exceptional 7.3% |
| Potawatomi | 99.7 /100 | #83 | Exceptional 7.3% |
| Afghans | 99.7 /100 | #84 | Exceptional 7.3% |
| Cree | 99.7 /100 | #85 | Exceptional 7.2% |
| Immigrants | Indonesia | 99.6 /100 | #86 | Exceptional 7.2% |
| Delaware | 99.6 /100 | #87 | Exceptional 7.2% |
| Immigrants | Nonimmigrants | 99.6 /100 | #88 | Exceptional 7.2% |
| British | 99.6 /100 | #89 | Exceptional 7.2% |
| Creek | 99.6 /100 | #90 | Exceptional 7.2% |