Immigrants from Netherlands vs Immigrants from Belgium College, Under 1 year
COMPARE
Immigrants from Netherlands
Immigrants from Belgium
College, Under 1 year
College, Under 1 year Comparison
Immigrants from Netherlands
Immigrants from Belgium
70.0%
COLLEGE, UNDER 1 YEAR
99.8/ 100
METRIC RATING
48th/ 347
METRIC RANK
71.5%
COLLEGE, UNDER 1 YEAR
100.0/ 100
METRIC RATING
21st/ 347
METRIC RANK
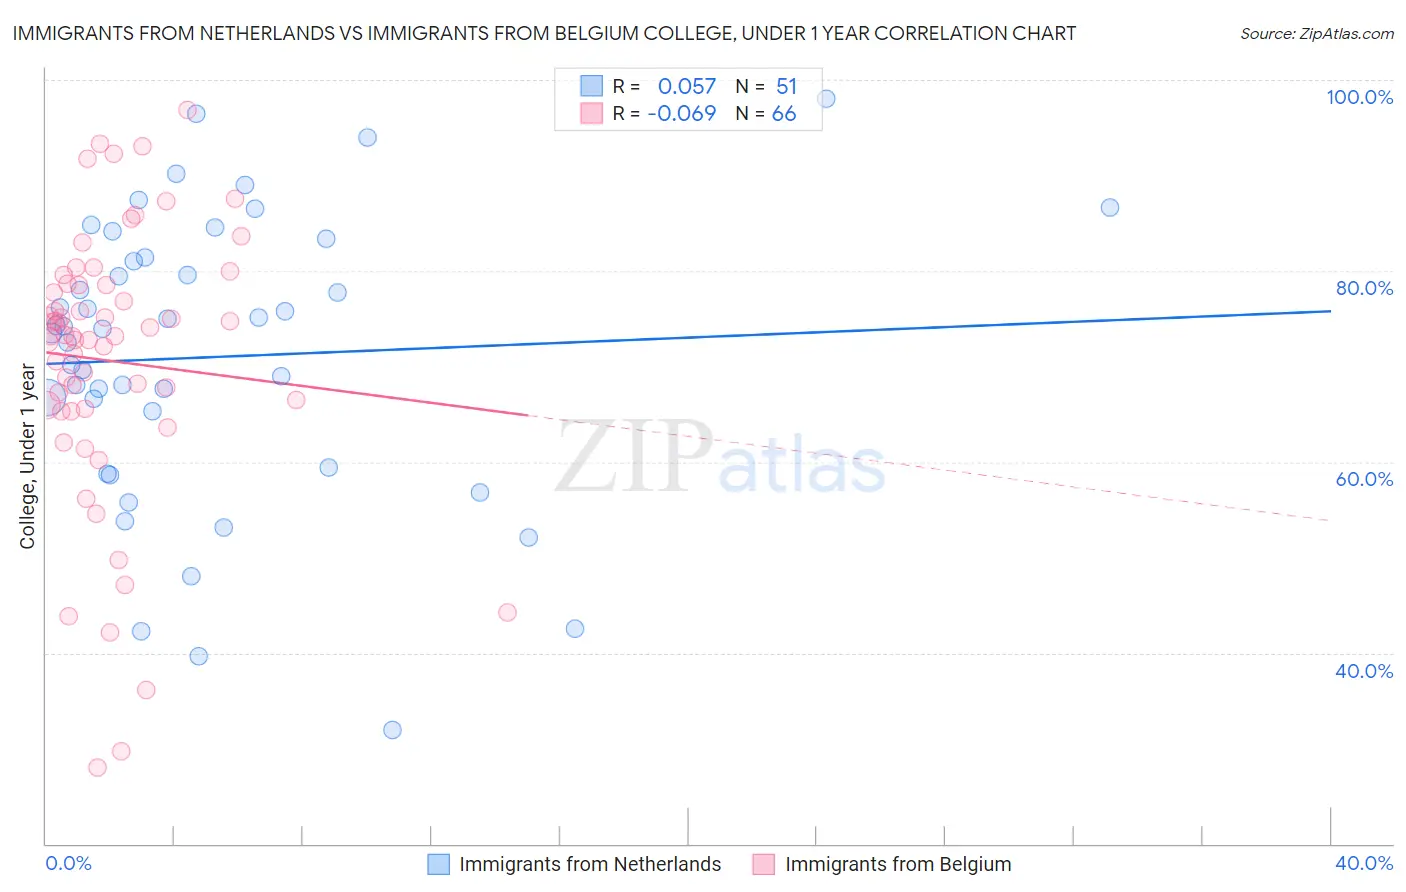
Immigrants from Netherlands vs Immigrants from Belgium College, Under 1 year Correlation Chart
The statistical analysis conducted on geographies consisting of 237,877,405 people shows a slight positive correlation between the proportion of Immigrants from Netherlands and percentage of population with at least college, under 1 year education in the United States with a correlation coefficient (R) of 0.057 and weighted average of 70.0%. Similarly, the statistical analysis conducted on geographies consisting of 146,729,232 people shows a slight negative correlation between the proportion of Immigrants from Belgium and percentage of population with at least college, under 1 year education in the United States with a correlation coefficient (R) of -0.069 and weighted average of 71.5%, a difference of 2.1%.
College, Under 1 year Correlation Summary
| Measurement | Immigrants from Netherlands | Immigrants from Belgium |
| Minimum | 32.0% | 28.0% |
| Maximum | 98.1% | 96.9% |
| Range | 66.1% | 68.9% |
| Mean | 71.0% | 70.6% |
| Median | 73.9% | 73.2% |
| Interquartile 25% (IQ1) | 59.4% | 65.6% |
| Interquartile 75% (IQ3) | 81.4% | 78.5% |
| Interquartile Range (IQR) | 22.0% | 13.0% |
| Standard Deviation (Sample) | 15.0% | 14.5% |
| Standard Deviation (Population) | 14.9% | 14.4% |
Similar Demographics by College, Under 1 year
Demographics Similar to Immigrants from Netherlands by College, Under 1 year
In terms of college, under 1 year, the demographic groups most similar to Immigrants from Netherlands are Immigrants from Austria (70.0%, a difference of 0.040%), Immigrants from Bulgaria (70.0%, a difference of 0.060%), Zimbabwean (69.9%, a difference of 0.16%), Immigrants from Latvia (70.1%, a difference of 0.17%), and Mongolian (69.9%, a difference of 0.20%).
| Demographics | Rating | Rank | College, Under 1 year |
| Immigrants | Kuwait | 99.9 /100 | #41 | Exceptional 70.3% |
| Immigrants | Lithuania | 99.9 /100 | #42 | Exceptional 70.3% |
| Israelis | 99.9 /100 | #43 | Exceptional 70.2% |
| New Zealanders | 99.9 /100 | #44 | Exceptional 70.2% |
| Immigrants | Norway | 99.9 /100 | #45 | Exceptional 70.2% |
| Immigrants | Latvia | 99.9 /100 | #46 | Exceptional 70.1% |
| Immigrants | Bulgaria | 99.8 /100 | #47 | Exceptional 70.0% |
| Immigrants | Netherlands | 99.8 /100 | #48 | Exceptional 70.0% |
| Immigrants | Austria | 99.8 /100 | #49 | Exceptional 70.0% |
| Zimbabweans | 99.8 /100 | #50 | Exceptional 69.9% |
| Mongolians | 99.8 /100 | #51 | Exceptional 69.9% |
| Immigrants | Russia | 99.8 /100 | #52 | Exceptional 69.9% |
| South Africans | 99.7 /100 | #53 | Exceptional 69.7% |
| Immigrants | Czechoslovakia | 99.7 /100 | #54 | Exceptional 69.6% |
| Maltese | 99.7 /100 | #55 | Exceptional 69.5% |
Demographics Similar to Immigrants from Belgium by College, Under 1 year
In terms of college, under 1 year, the demographic groups most similar to Immigrants from Belgium are Immigrants from Korea (71.6%, a difference of 0.15%), Latvian (71.6%, a difference of 0.19%), Immigrants from Eastern Asia (71.3%, a difference of 0.25%), Immigrants from Switzerland (71.7%, a difference of 0.30%), and Eastern European (71.8%, a difference of 0.43%).
| Demographics | Rating | Rank | College, Under 1 year |
| Cambodians | 100.0 /100 | #14 | Exceptional 71.9% |
| Burmese | 100.0 /100 | #15 | Exceptional 71.9% |
| Immigrants | Japan | 100.0 /100 | #16 | Exceptional 71.9% |
| Eastern Europeans | 100.0 /100 | #17 | Exceptional 71.8% |
| Immigrants | Switzerland | 100.0 /100 | #18 | Exceptional 71.7% |
| Latvians | 100.0 /100 | #19 | Exceptional 71.6% |
| Immigrants | Korea | 100.0 /100 | #20 | Exceptional 71.6% |
| Immigrants | Belgium | 100.0 /100 | #21 | Exceptional 71.5% |
| Immigrants | Eastern Asia | 100.0 /100 | #22 | Exceptional 71.3% |
| Immigrants | Northern Europe | 100.0 /100 | #23 | Exceptional 71.1% |
| Soviet Union | 100.0 /100 | #24 | Exceptional 71.1% |
| Bulgarians | 100.0 /100 | #25 | Exceptional 71.1% |
| Immigrants | Denmark | 100.0 /100 | #26 | Exceptional 71.0% |
| Immigrants | Ireland | 100.0 /100 | #27 | Exceptional 71.0% |
| Immigrants | Hong Kong | 100.0 /100 | #28 | Exceptional 71.0% |