Immigrants from Nepal vs Ottawa College, 1 year or more
COMPARE
Immigrants from Nepal
Ottawa
College, 1 year or more
College, 1 year or more Comparison
Immigrants from Nepal
Ottawa
62.0%
COLLEGE, 1 YEAR OR MORE
96.3/ 100
METRIC RATING
105th/ 347
METRIC RANK
54.9%
COLLEGE, 1 YEAR OR MORE
0.3/ 100
METRIC RATING
261st/ 347
METRIC RANK
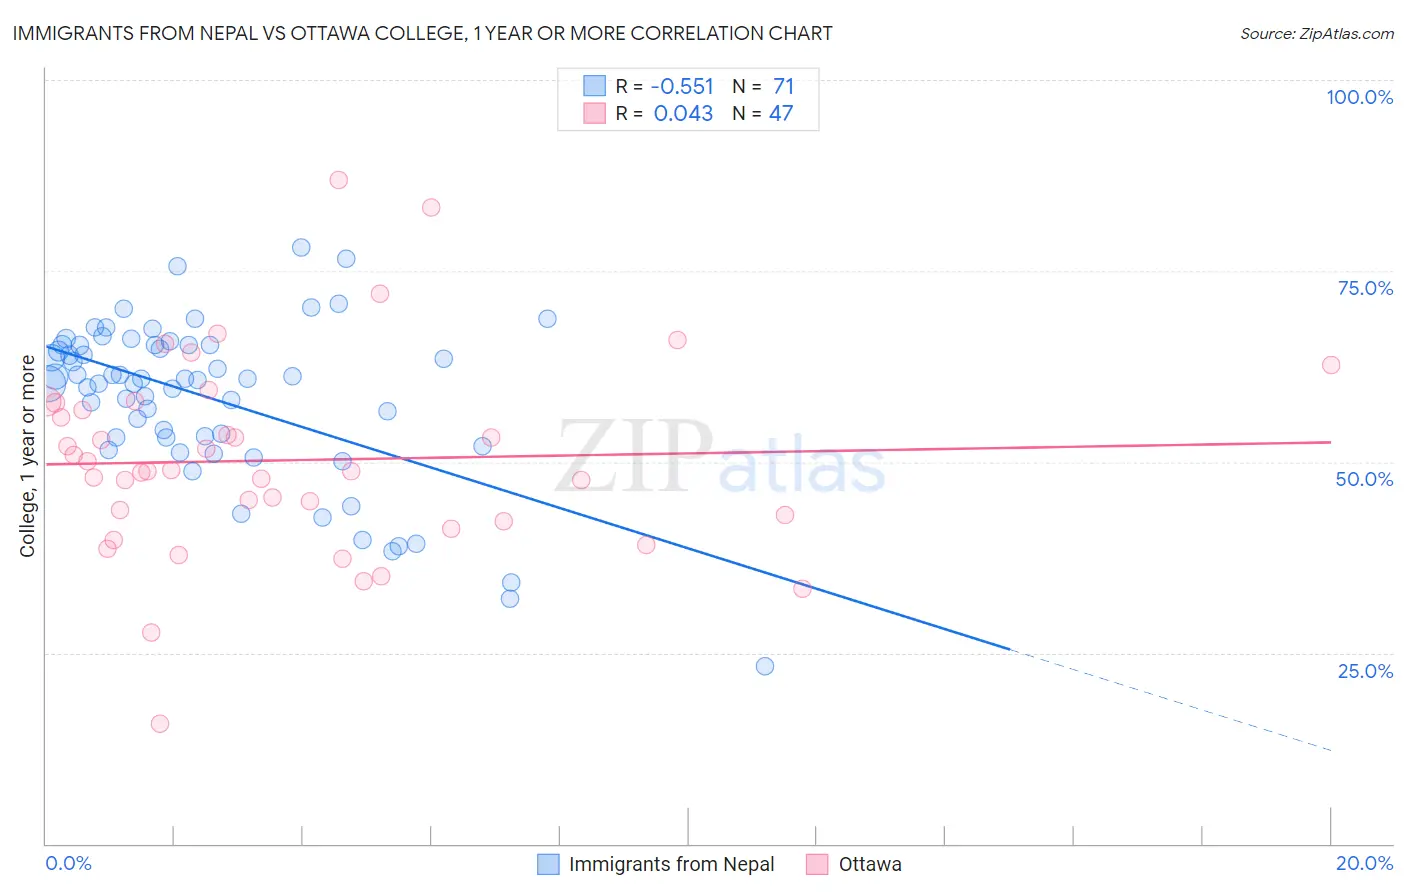
Immigrants from Nepal vs Ottawa College, 1 year or more Correlation Chart
The statistical analysis conducted on geographies consisting of 186,770,697 people shows a substantial negative correlation between the proportion of Immigrants from Nepal and percentage of population with at least college, 1 year or more education in the United States with a correlation coefficient (R) of -0.551 and weighted average of 62.0%. Similarly, the statistical analysis conducted on geographies consisting of 49,956,602 people shows no correlation between the proportion of Ottawa and percentage of population with at least college, 1 year or more education in the United States with a correlation coefficient (R) of 0.043 and weighted average of 54.9%, a difference of 13.0%.
College, 1 year or more Correlation Summary
| Measurement | Immigrants from Nepal | Ottawa |
| Minimum | 23.3% | 15.7% |
| Maximum | 78.1% | 86.9% |
| Range | 54.8% | 71.3% |
| Mean | 58.2% | 50.2% |
| Median | 60.8% | 48.8% |
| Interquartile 25% (IQ1) | 53.2% | 42.2% |
| Interquartile 75% (IQ3) | 65.3% | 57.7% |
| Interquartile Range (IQR) | 12.1% | 15.5% |
| Standard Deviation (Sample) | 10.6% | 13.1% |
| Standard Deviation (Population) | 10.6% | 13.0% |
Similar Demographics by College, 1 year or more
Demographics Similar to Immigrants from Nepal by College, 1 year or more
In terms of college, 1 year or more, the demographic groups most similar to Immigrants from Nepal are Palestinian (62.0%, a difference of 0.0%), Chilean (62.0%, a difference of 0.020%), Afghan (62.0%, a difference of 0.030%), Luxembourger (62.1%, a difference of 0.15%), and Swedish (62.1%, a difference of 0.16%).
| Demographics | Rating | Rank | College, 1 year or more |
| Carpatho Rusyns | 97.2 /100 | #98 | Exceptional 62.2% |
| Croatians | 97.1 /100 | #99 | Exceptional 62.2% |
| Icelanders | 96.8 /100 | #100 | Exceptional 62.1% |
| Swedes | 96.8 /100 | #101 | Exceptional 62.1% |
| Luxembourgers | 96.7 /100 | #102 | Exceptional 62.1% |
| Afghans | 96.4 /100 | #103 | Exceptional 62.0% |
| Chileans | 96.4 /100 | #104 | Exceptional 62.0% |
| Immigrants | Nepal | 96.3 /100 | #105 | Exceptional 62.0% |
| Palestinians | 96.3 /100 | #106 | Exceptional 62.0% |
| Immigrants | Ukraine | 95.8 /100 | #107 | Exceptional 61.9% |
| Syrians | 95.7 /100 | #108 | Exceptional 61.9% |
| Immigrants | Northern Africa | 95.7 /100 | #109 | Exceptional 61.9% |
| Europeans | 95.6 /100 | #110 | Exceptional 61.8% |
| Macedonians | 95.6 /100 | #111 | Exceptional 61.8% |
| Austrians | 95.4 /100 | #112 | Exceptional 61.8% |
Demographics Similar to Ottawa by College, 1 year or more
In terms of college, 1 year or more, the demographic groups most similar to Ottawa are Jamaican (54.9%, a difference of 0.030%), Immigrants from St. Vincent and the Grenadines (54.8%, a difference of 0.080%), U.S. Virgin Islander (54.8%, a difference of 0.11%), Nepalese (54.9%, a difference of 0.13%), and Immigrants from Micronesia (54.8%, a difference of 0.13%).
| Demographics | Rating | Rank | College, 1 year or more |
| Japanese | 0.5 /100 | #254 | Tragic 55.2% |
| Immigrants | Bahamas | 0.5 /100 | #255 | Tragic 55.2% |
| Immigrants | West Indies | 0.5 /100 | #256 | Tragic 55.2% |
| Indonesians | 0.4 /100 | #257 | Tragic 55.1% |
| Africans | 0.4 /100 | #258 | Tragic 55.0% |
| Nepalese | 0.3 /100 | #259 | Tragic 54.9% |
| Jamaicans | 0.3 /100 | #260 | Tragic 54.9% |
| Ottawa | 0.3 /100 | #261 | Tragic 54.9% |
| Immigrants | St. Vincent and the Grenadines | 0.3 /100 | #262 | Tragic 54.8% |
| U.S. Virgin Islanders | 0.3 /100 | #263 | Tragic 54.8% |
| Immigrants | Micronesia | 0.3 /100 | #264 | Tragic 54.8% |
| Immigrants | Laos | 0.2 /100 | #265 | Tragic 54.7% |
| Potawatomi | 0.2 /100 | #266 | Tragic 54.6% |
| Blackfeet | 0.2 /100 | #267 | Tragic 54.6% |
| British West Indians | 0.2 /100 | #268 | Tragic 54.5% |